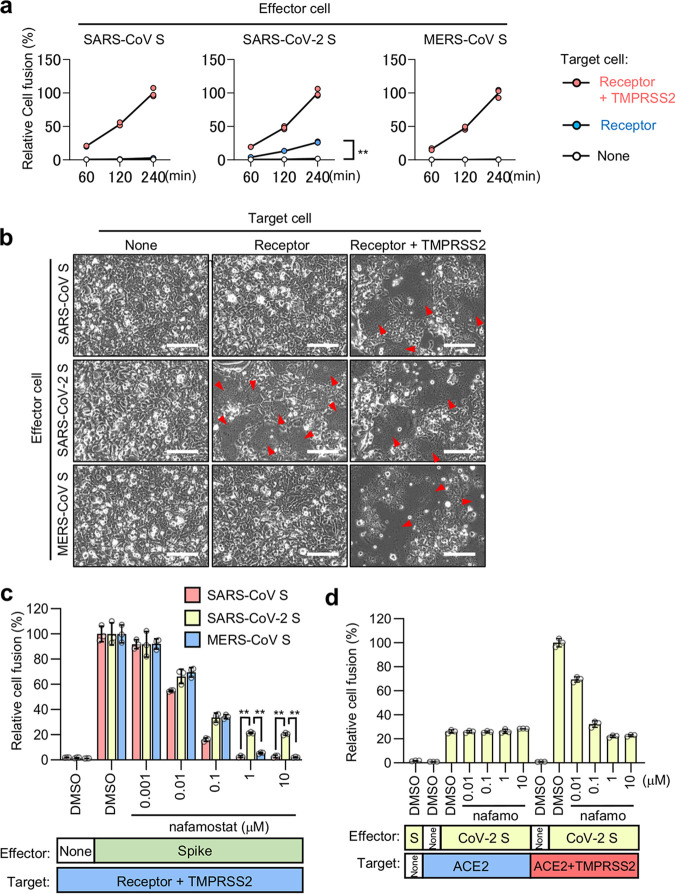
FIG 1.
ACE2-dependent but TMPRSS2-independent membrane fusion activity of the SARS-CoV-2 S protein. (a) Cell fusion kinetics induced by the S proteins from SARS-CoV, SARS-CoV-2, and MERS-CoV were determined using the DSP assay. Target cells expressing ACE2 alone or together with TMPRSS2 were used for coculturing with effector cells expressing SARS-CoV S and SARS-CoV-2 S, and cells expressing CD26 alone or together with TMPRSS2 were used for coculturing with effector cells expressing MERS-CoV S. Relative cell fusion values were calculated by normalizing the RL activity of each coculture to that of the coculture with cells expressing both receptor and TMPRSS2 at 240 min, which was set to 100%. Values are means ± standard deviations (SD) (n = 3/group). **, P < 0.01. (b) Phase-contrast images of S protein-mediated cell fusion 16 h after coculture. Red arrowheads indicate syncytium formation. Scale bars, 100 μm. (c) Effect of nafamostat on TMPRSS2-dependent cell fusion. Target cells expressing ACE2 with TMPRSS2 were used for coculturing with effector cells expressing SARS-CoV S and SARS-CoV-2 S, and cells expressing CD26 with TMPRSS2 were used for coculturing with effector cells expressing MERS-CoV S. Relative cell fusion values were calculated by normalizing the RL activity for each coculture to that of the coculture with cells expressing both receptor and TMPRSS2 in the presence of DMSO, which was set to 100%. Values are means ± SD (n = 3/group). **, P < 0.01. (d) Effects of nafamostat on TMPRSS2-independent or -dependent cell fusion. Target cells expressing ACE2 alone or together with TMPRSS2 were used for coculturing with effector cells expressing SARS-CoV-2 S. Relative cell fusion values were calculated by normalizing the RL activity for each coculture to that of the coculture with cells expressing both ACE2 and TMPRSS2 in the presence of DMSO, which was set to 100%. Values are means ± SD (n = 3/group). nafamo, nafamostat.

