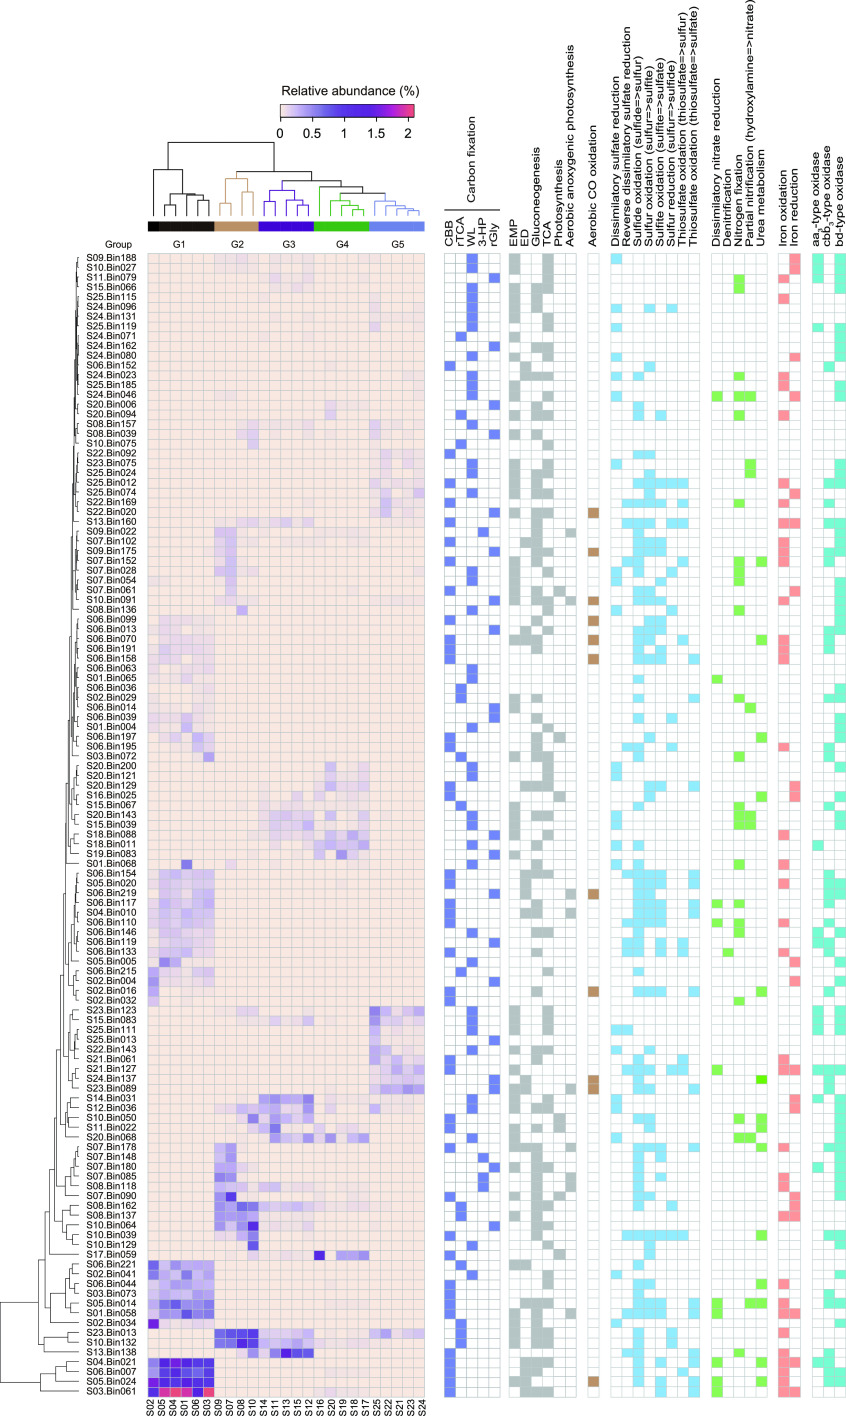
FIG 2.
Heat map plotting the abundance pattern of 117 MAGs and presence of metabolic pathways. MAGs were organized and clustered by their relative abundance in samples, which correlated with salinity groups. The data for relative abundance of each MAG are provided in Data Set S1d, and details of metabolic pathways are provided in Data Set S1b and S1e to h. CBB, Calvin-Benson-Bassham cycle; rTCA, reductive citric acid cycle; WL, Wood-Ljungdahl pathway; 3-HP, 3-hydroxypropionate bicycle; rGly, reductive glycine pathway; EMP, Embden-Meyerhof-Parnas pathway; ED, Entner-Doudoroff pathway; TCA, citric acid cycle.

