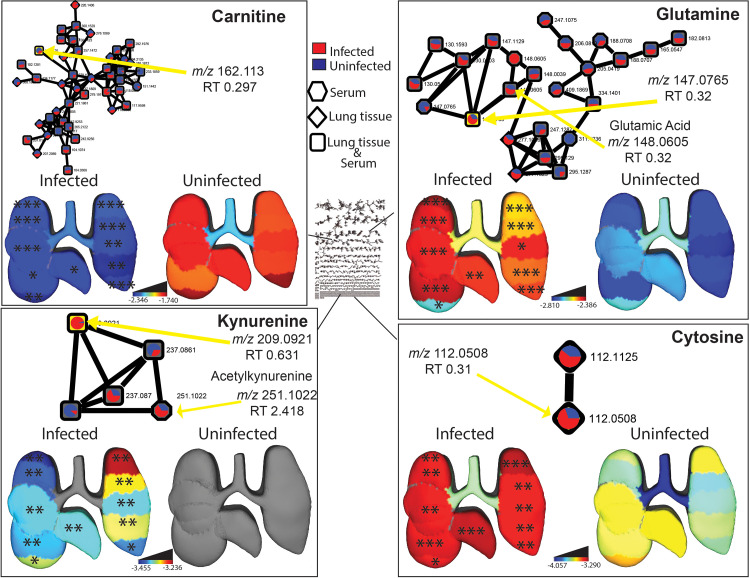
FIG 3.
Representative metabolites perturbed by IAV infection. n = 16 infected mice and n = 10 uninfected mice. Molecular networks display the mean peak area of metabolites in infected (red) and uninfected (blue) samples. Each connected node represents structurally related metabolites, as determined by molecular networking. 3D lung ’ili plots show the log median of the TIC-normalized peak area of each displayed metabolite across tissue sites. Median values of zero remain uncolored (gray model background). Wilcoxon FDR-corrected P values comparing matched infected and uninfected lung tissue sites; *, P < 0.05; **, P < 0.01; ***, P < 0.001.

