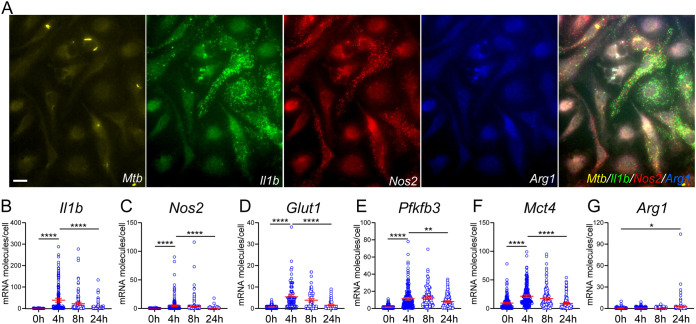
FIG 1.
Single-cell mRNA analysis of immunometabolic markers in M. tuberculosis-infected BMDMs. BMDMs seeded on coverslips were probed in 3-plex hybridization reactions using sm-RNA-FISH probes labeled with transcript-specific probe sets (about 50 oligonucleotides for each mRNA) that were coupled to tetramethylrhodamine (TMR), Texas Red, or Cy5 fluorophores. Images were acquired in Z-stacks of different fields of cells in different channels. Fluorescence spots corresponding to single mRNA molecules in individual cells were counted in the merged Z-stacks using a custom image-processing algorithm implemented in MATLAB. (A) Representative images of GFP-labeled M. tuberculosis (Mtb; yellow) and mRNA molecule spots for Il1b (green), Nos2 (red), and Arg1 (blue) at 8 hpi in Z-stacks of the same field of cells in different channels and merged together. (B to G) Changes of respective mRNA molecules of immunometabolic markers in individual cells at 0, 4, 8, and 24 hpi. A total of ~100 to 150 cells were analyzed by sm-RNA-FISH at the indicated times p.i. Each circle represents one cell. Representative data are shown as means ± 95% CI (confidence interval) from at least three independent experiments. Statistical significance at *, P < 0.05, **, P < 0.01, ***, P < 0.001 and ****, P < 0.0001 was based on two-tailed student’s t test. The scale bar in panel A is 10 μm.

