FIG 3.
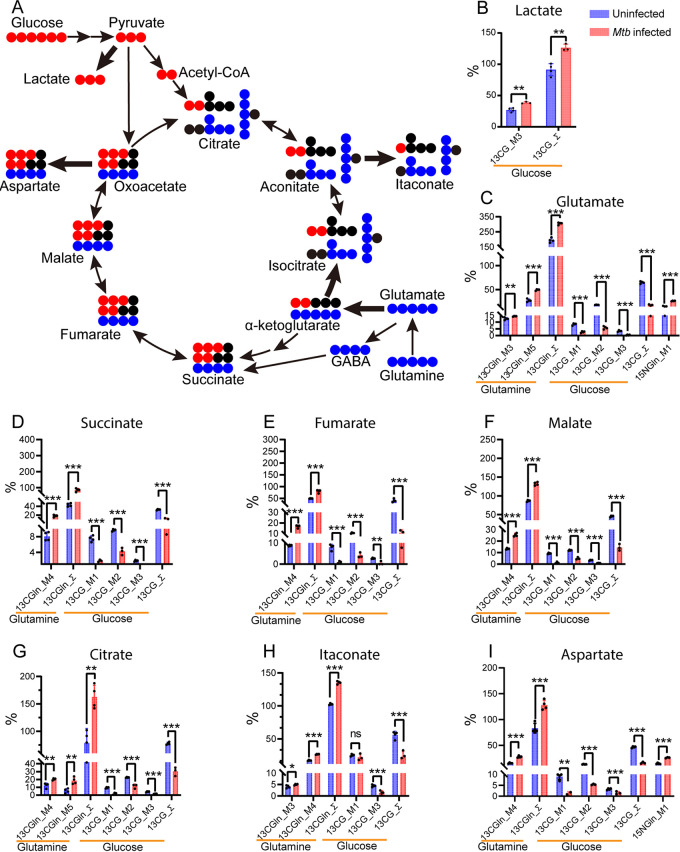
Isotope labeling distribution pattern of U13C glucose and glutamine and U15N glutamine during the M1-like polarization. (A) Diagram of 13C distribution from the catabolism of U13C glucose and U13C glutamine in glycolysis and/or the TCA cycle. Catabolism of U13C glucose generates M + 3 glycolytic intermediates and M + 2 (via pyruvate oxidation) and M + 3 (via pyruvate carboxylation) TCA cycle intermediates/derivatives. M + 5 glutamate, the direct metabolite of U13C glutamine, can enter the TCA cycle in the form of alpha ketoglutarate (α-KG) and/or via the GABA shunt. Increased 13C distribution from U13C glucose catabolism in glycolysis (B) with the generation of M + 3 lactate and (C to I) from the catabolism of U13C glutamine in the oxidative and reductive TCA cycle resulting in the generation of TCA cycle intermediates/derivatives. M1-like polarization was marked by diverting the 13C glucose carbon distribution from the TCA cycle M + 2, M + 1, and M + 3 intermediates to the formation of M + 3 lactate (A). In contrast, catabolism of U13C glutamine led to increased 13C distribution in the form of M + 4 TCA cycle intermediates/derivatives, including succinate (D), fumarate (E), malate (F), itaconate (H), and aspartate (I), as well as M + 4 and M + 5 citrate (G), indicating the simultaneous operation of both the oxidative and reductive TCA cycle. Increased 15N distribution from U15N glutamine to M + 1 aspartate (I) also indicates glutamine being a nitrogen source for the formation of nonessential amino acid aspartate. Solid red and blue circles represent 13C from U13C glucose and U13C glutamine, respectively. Thick arrows indicate increased 13C carbon flux into the formation of lactate and the TCA cycle intermediates or derivatives, respectively. Enrichment calculated from U13C glucose was marked as 13CG_M1, 13CG_M2, 13CG_M3, and 13CG_Σ. Σ was calculated with M1 × 1 + M2 × 2…+ Mn × n. Enrichment calculated from U13C glutamine was marked as 13CGln_M3, 13CGln_M4, 13CGln_M5, and 13CGln_Σ. Enrichment calculated from 15N glutamine was marked as 15NGln_M1. Data are shown as means ± standard deviation (S.D.) from 3 to 4 biological replicates. Statistical significance at *, P < 0.05, **, P < 0.01, ***, P < 0.001 and ****, P < 0.0001 was based on two-tailed student’s t test.

