FIG 4.
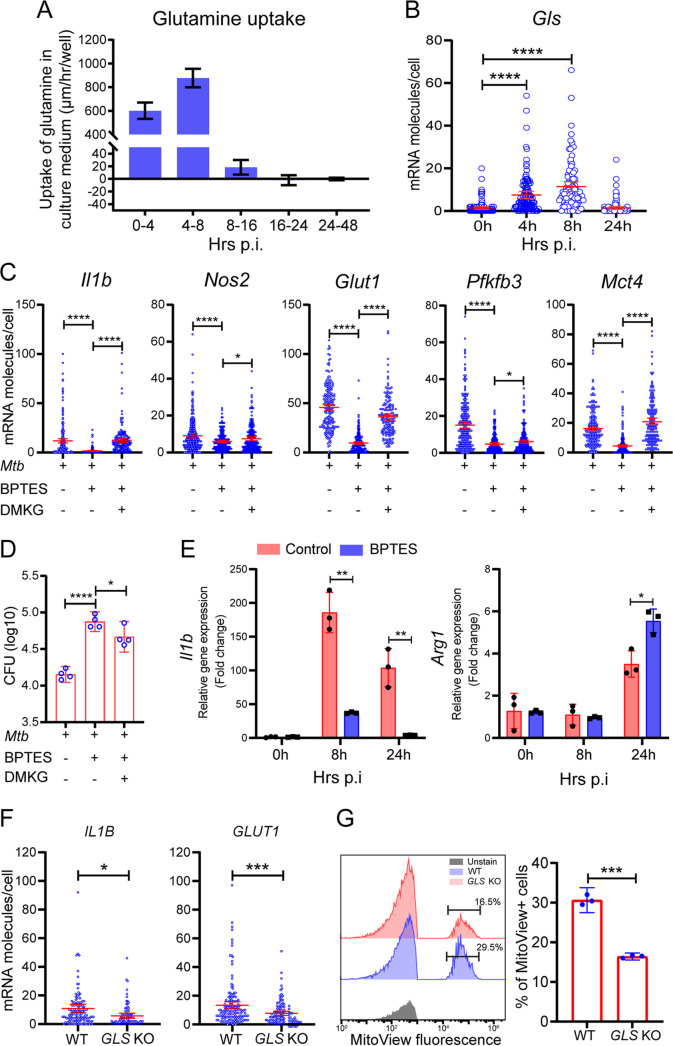
Requirement of glutamine for M1-like polarization. BMDMs were infected with M. tuberculosis, and cells and supernatants were collected at various times for single-cell mRNA analysis by sm-RNA-FISH and for measurement of glutamine uptake/utilization. Glutaminase (GLS) inhibitor BPTES was added to sets of cultures for GLS inhibition experiments at a final concentration of 10 μM. For rescue experiments, 1.5 mM dimethyl α-ketoglutarate (DMKG) was added to sets of cultures treated with the inhibitor. (A) High rate of glutamine uptake/utilization by M. tuberculosis-infected macrophages corresponding to the M1-like polarization. Cell culture supernatants collected at the indicated times were subjected to glutamine determination using the glutamine/glutamate-glo assay kit. Kinetics of glutamine uptake/utilization (μm per hour per well) were calculated based on its changes in the culture medium. Data are shown as means ± S.D. from three independent experiments. (B) Increased mRNA molecules for glutaminase gene Gls in M1-like macrophages. Gls mRNA molecules in infected BMDMs were detected and analyzed by sm-RNA-FISH as described in Fig. 1. (C) Diminished M1-like polarization by GLS inhibition with BPTES and alleviation of the inhibition by treatment with DMKG. mRNA molecules in infected BMDMs, with or without 10 μM BPTES and/or 1.5 mM DMKG at 8 hpi, were analyzed for Il1b, Nos2, Glut1, Pfkfb3, and Mct4 by sm-RNA-FISH as described in Fig. 1. (D) Enhanced M. tuberculosis growth by GLS inhibition with BPTES. CFU of M. tuberculosis was determined by plating assay of cell lysates of infected BMDMs with indicated treatments at day 3 p.i. (E) Increased expression of Arg1 and decreased Il1b in infected and BPTES-treated BMDMs. (F and G) Expression of Il1b and Arg1 was determined by RT-PCR and normalized to the expression level of Actb. Dampened M1 polarization in THP-1 Gls KO macrophages. Wild-type THP1 cells and Gls KO cells, generated by the Synthego Corporation, were subjected to differentiation and M. tuberculosis infection. mRNA expression of IL1B and GLUT1 was analyzed by sm-RNA-FISH (F) as described in Fig. 1. FISH data are shown as means ±95% CI and represent three independent experiments. (G) Mitochondrial mass was evaluated using MitoView Fix 640 by flow cytometry and quantified (left: gating strategy; right: quantification). Data are shown as means ± S.D. from three independent experiments. Statistical significance at *, P < 0.05, **, P < 0.01, ***, P < 0.001 and ****, P < 0.0001 was based on two-tailed student’s t test.

