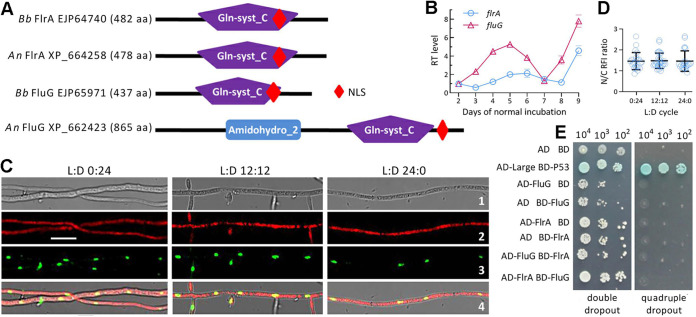
FIG 1.
Transcription profile and subcellular localization of FlrA and its relationship with FluG in B. bassiana. (A) Sequence comparison of B. bassiana (Bb) FlrA and FluG with A. nidulans (An) counterparts. Domains and NLS motif were predicted from each protein at http://smart.embl-heidelberg.de/ and https://nls-mapper.iab.keio.ac.jp/cgi-bin/NLS_Mapper_form.cgi, respectively. (B) Relative transcript (RT) levels of flrA and fluG in the SDAY cultures of wild-type (WT) Bb strain during a 7-day incubation at the optimal regime of 25°C and L:D 12:12 with respect to the standard level on day 2. (C) LSCM images (scale bars: 5 μm) for subcellular localization of red fluorescence-tagged FlrA fusion protein expressed in the WT strain. Cell samples were taken from the 3-day-old SDBY cultures grown at 25°C in the L:D cycles of 0:24, 12:12, and 24:0 and stained with the nuclear dye DAPI (shown in green). Bright, expressed, stained and merged views of the same field are shown in images 1, 2, 3, and 4, respectively. (D) Nuclear versus cytoplasmic red fluorescence intensity (N/C-RFI) ratios of the fusion protein in the hyphal cells. Error bars denote standard deviations (SDs) of the means from three cDNA samples analyzed via qPCR (B) or 23 to 32 cells in the examined hyphae (D). (E) Y2H assay for an interaction of FlrA with FluG (AD-FlrA BD-FluG) or of FluG with FlrA (AD-FluG BD-FlrA). Note that the constructed diploid cells except positive control (AD-Large BD-P53) were unable to grow on the quadruple-dropout plate.

