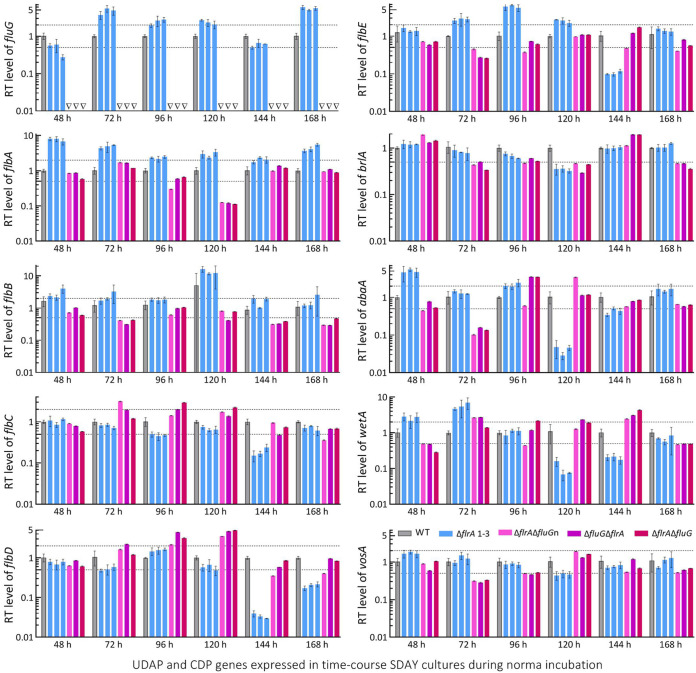
FIG 4.
Relative transcript (RT) levels of putative UDAP (fluG and flbA to flbE) and confirmed CDP (brlA, abaA, and wetA plus vosA) genes affected by disruption of flrA and double disruption of flrA and fluG in B. bassiana. The cDNA samples were derived daily from the SDAY cultures of each strain during a 7-day incubation at the optimal regime of 25°C and L:D 12:12 and subjected to qPCR analysis. The upper and lower dashed lines denote significant levels of 1-fold up- and downregulation with respect to the WT standard, respectively. Error bars: SDs of the means from three independent cDNA samples per strain.

