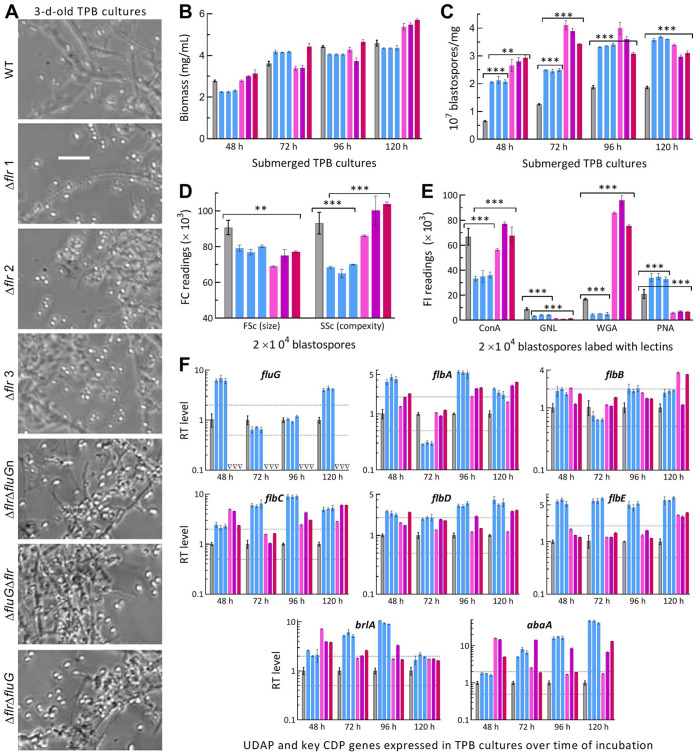
FIG 5.
Submerged blastospore production affected by disruption of flrA and double disruption of flrA and fluG in B. bassiana. (A) Microscopic images (scale bar: 20 μm) for a status of blastospore production in the 3-day-old cultures of a 106 conidia/mL TPB mimicking insect hemolymph. (B, C) Biomass levels and dimorphic transition rates measured from the TPB cultures during a 5-day incubation at 25°C, respectively. (D) Mean size and complexity of blastospores indicated by the FSc and SSc readings in flow cytometry (FC) of 2 × 10⁴ blastospores (per sample) from the 3-day-old TPB cultures. (E) Fluorescence intensity (FL) readings indicating the contents of hydrocarbon epitopes on the surfaces of 2 × 10⁴ blastospores (per sample) labeled with the fluorescent lectins ConA, WGA, GNL, and PNA, respectively. (F) Relative transcript (RT) levels of putative UDAP (fluG and flbA to flbE) and key CDP (brlA and abaA) genes in the TPB cultures of all mutants with respect to the WT standard during the 5-day incubation. Upper and lower dashed lines denote significant levels of 1-fold up- and downregulation, respectively. P < 0.05*, 0.01**, or 0.001*** in Tukey’s HSD tests. Error bars: SDs of the means from three independent replicates.

