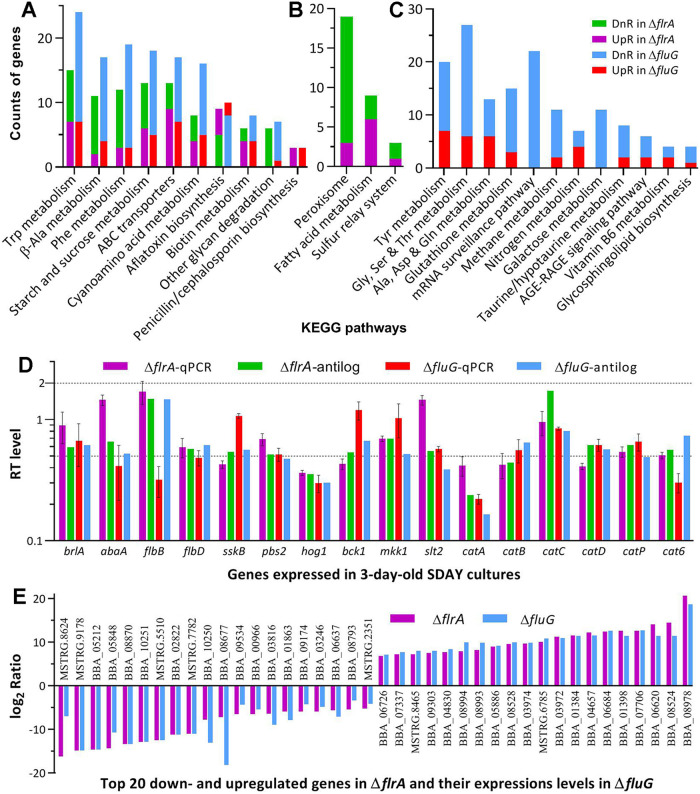
FIG 8.
Pathway and validity analyses of B. bassiana ΔfrlA- and ΔfluG-specific transcriptomes. (A to C) Counts of significantly upregulated (UpR) and downregulated (DnR) genes enriched to the same KEGG pathways of both ΔfrlA and ΔfluG mutants and different pathways of each mutant at the significant levels of P < 0.05, respectively. (D) Relative transcript (RT) levels of 16 qPCR-analyzed genes in the 3-day-old SDAY cultures of ΔfrlA and ΔfluG versus WT with their anti-log2 ratio values in the transcriptomes of the two mutants. Error bars: SDs of the means from three independent cDNA samples analyzed via qPCR. (E) The log2 ratio values of top 20 down- and upregulated genes in the ΔfrlA and ΔfluG mutants (see Table S4 for all co-up- or co-downregulated genes in the null mutants).

