FIG 2.
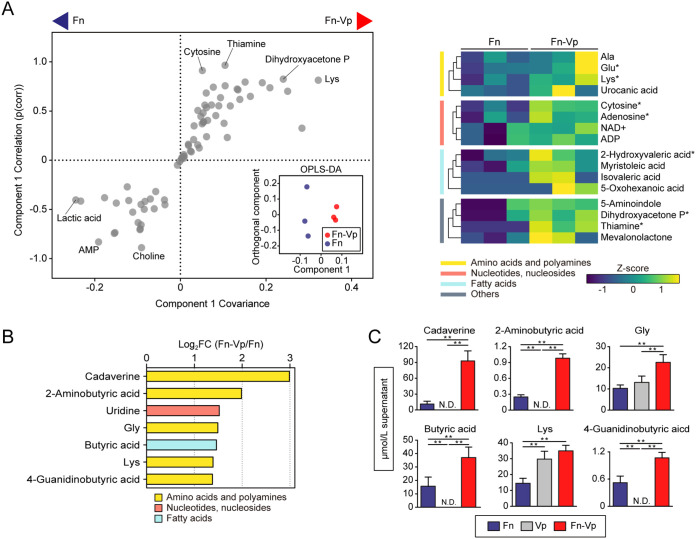
Intra- and extracellular metabolite changes of F. nucleatum cocultured with V. parvula. (A) Intracellular metabolite changes in F. nucleatum cocultured with V. parvula. OPLS-DA score plot (inset) and S-plot (left panel) show that lysine and thiamine were among the most impacted metabolites in cocultures. The right panel shows a clustered heatmap of intracellular metabolites with high reliability in the S-plot (p[corr] > 0.6). Columns represent biological replicates of F. nucleatum samples, grouped by culture method, and rows represent individual metabolites, whose levels are displayed as Z scores. *, P < 0.05 (Mann-Whitney U test). (B) Extracellular metabolites displaying a concentration change in cocultures compared to monocultures (log2 FC < −0.6, log2 FC > 1, and P < 0.05; Mann-Whitney U test). (C) Levels of the selected metabolites in spent media of cocultures and each monocultures, determined by UPLC. Error bars correspond to standard deviations. *, P < 0.05; **, P < 0.01 (one-way ANOVA with Tukey’s test). Fn, F. nucleatum subsp. nucleatum ATCC 25586; Vp, V. parvula JCM 12972.

