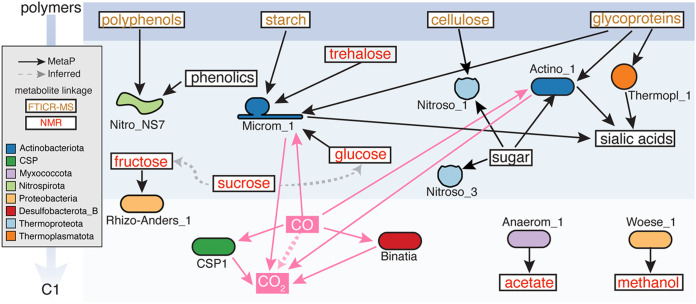
FIG 3.
Integrated metaproteomics and metabolomics suggest carbon transformations expressed by bacterial and archaeal lineages in river sediments. Background blue shading spans polymers (top) to single-carbon compounds (C1; bottom) (arrow on left). Detected metabolites are shown in boxes, with NMR-detected compounds indicated in red type, polymers from FTICR-MS in orange type, and undetected metabolites in black type. MAG-resolved metaproteome information is indicated by solid arrows, with MAG icons colored by phylum. Pink arrows indicate processes that are expressed and could contribute to CO2 production, while black arrows indicate other carbon-transforming genes expressed in the proteome. Dotted arrows represent transformations supported by only one method: (i) gray dotted arrow indicates metabolites and downstream products (but no proteome support) and (ii) pink dotted arrow indicates metaproteomic evidence (but no geochemistry or metabolite support).

