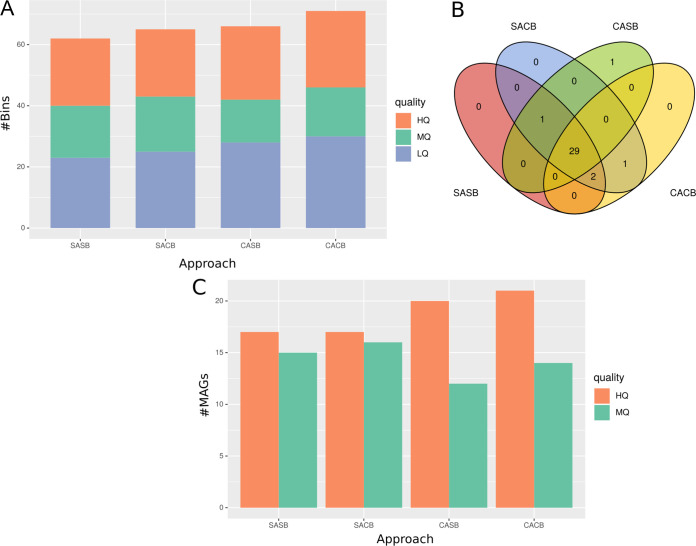
FIG 3.
Evaluating assembly-binning strategies on simulated metagenomes. (A) Total number of bins obtained after the binning step. colors represent quality of genome bins estimated using CheckM: high quality (HQ), medium quality (MQ), and low quality (LQ). (B) Number of source genomes found in each strategy. Each number represents the number of times a MAG from a strategy maps against a source genome. Intersections represent common genomes between strategies. (C) Number of dereplicated MAGs obtained, after independent dereplication by dRep for each strategy. As the genomes are all represented with one single strain, dereplication at either species or strain resolution gives the same number of dereplicated genomes, so only one dereplication resolution is shown.

