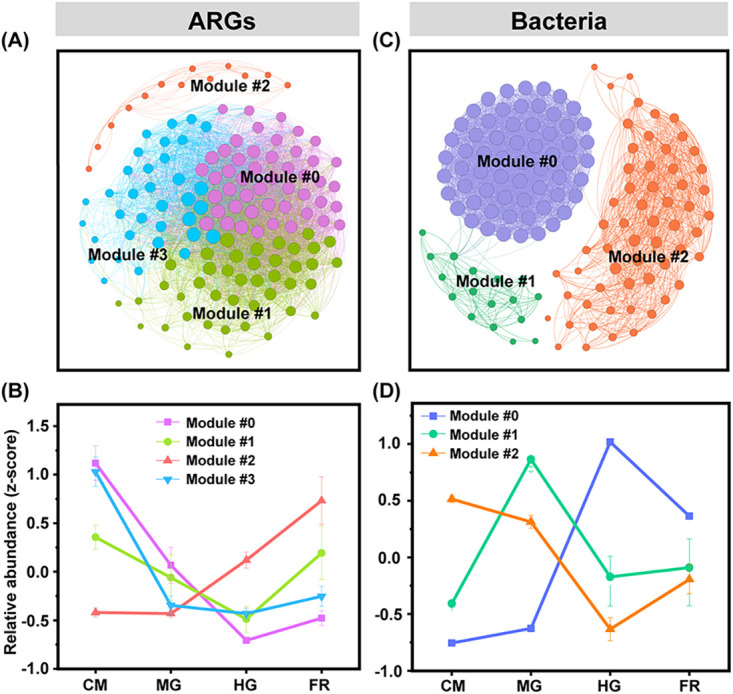
FIG 3.

Co-occurrence network analysis of ARGs (A) and bacterial communities (C) and relative abundances of modules (B and D). In panels A and C, each node represents an ARG subtype or bacterial OTU. The different colors of the nodes represent the different ecological modules. The relative abundance of each module was normalized by the z-score method (i.e., the mean of all values is 0 and the standard deviation is 1).
