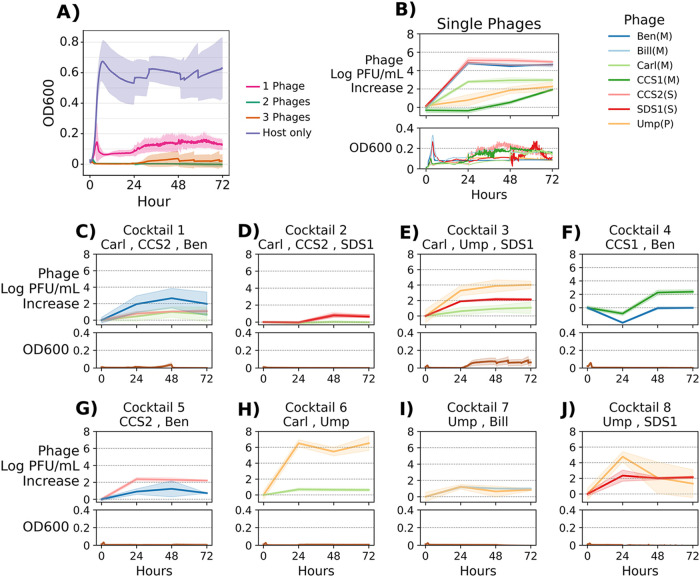
FIG 4.
Phage abundances and E. faecalis Yi6-1 growth with phage cocktails. Phage was added at hour 0, and the cultures were grown for 72 h. Individual phage abundances were measured by qPCR and plotted as the replicate mean ± SEM of the log PFU per milliliter increase from hour 0. (A) Bacterial growth when E. faecalis Yi6-1 was grown alone (host only), with each phage separately (1 phage), or with phage cocktails (2 phages, 3 phages). The replicate mean ± SEM OD600 is shown. (B) Each phage was added separately to growing E. faecalis Yi6-1 cultures. The phage abundance is plotted in the top panel, and the bacterial growth curve is shown in the bottom panel. (C to J) Phage cocktails were added to growing E. faecalis Yi6-1 cultures. The abundance of each phage cocktail is plotted in the top panel, and the bacterial growth curve is plotted in the bottom panel.

