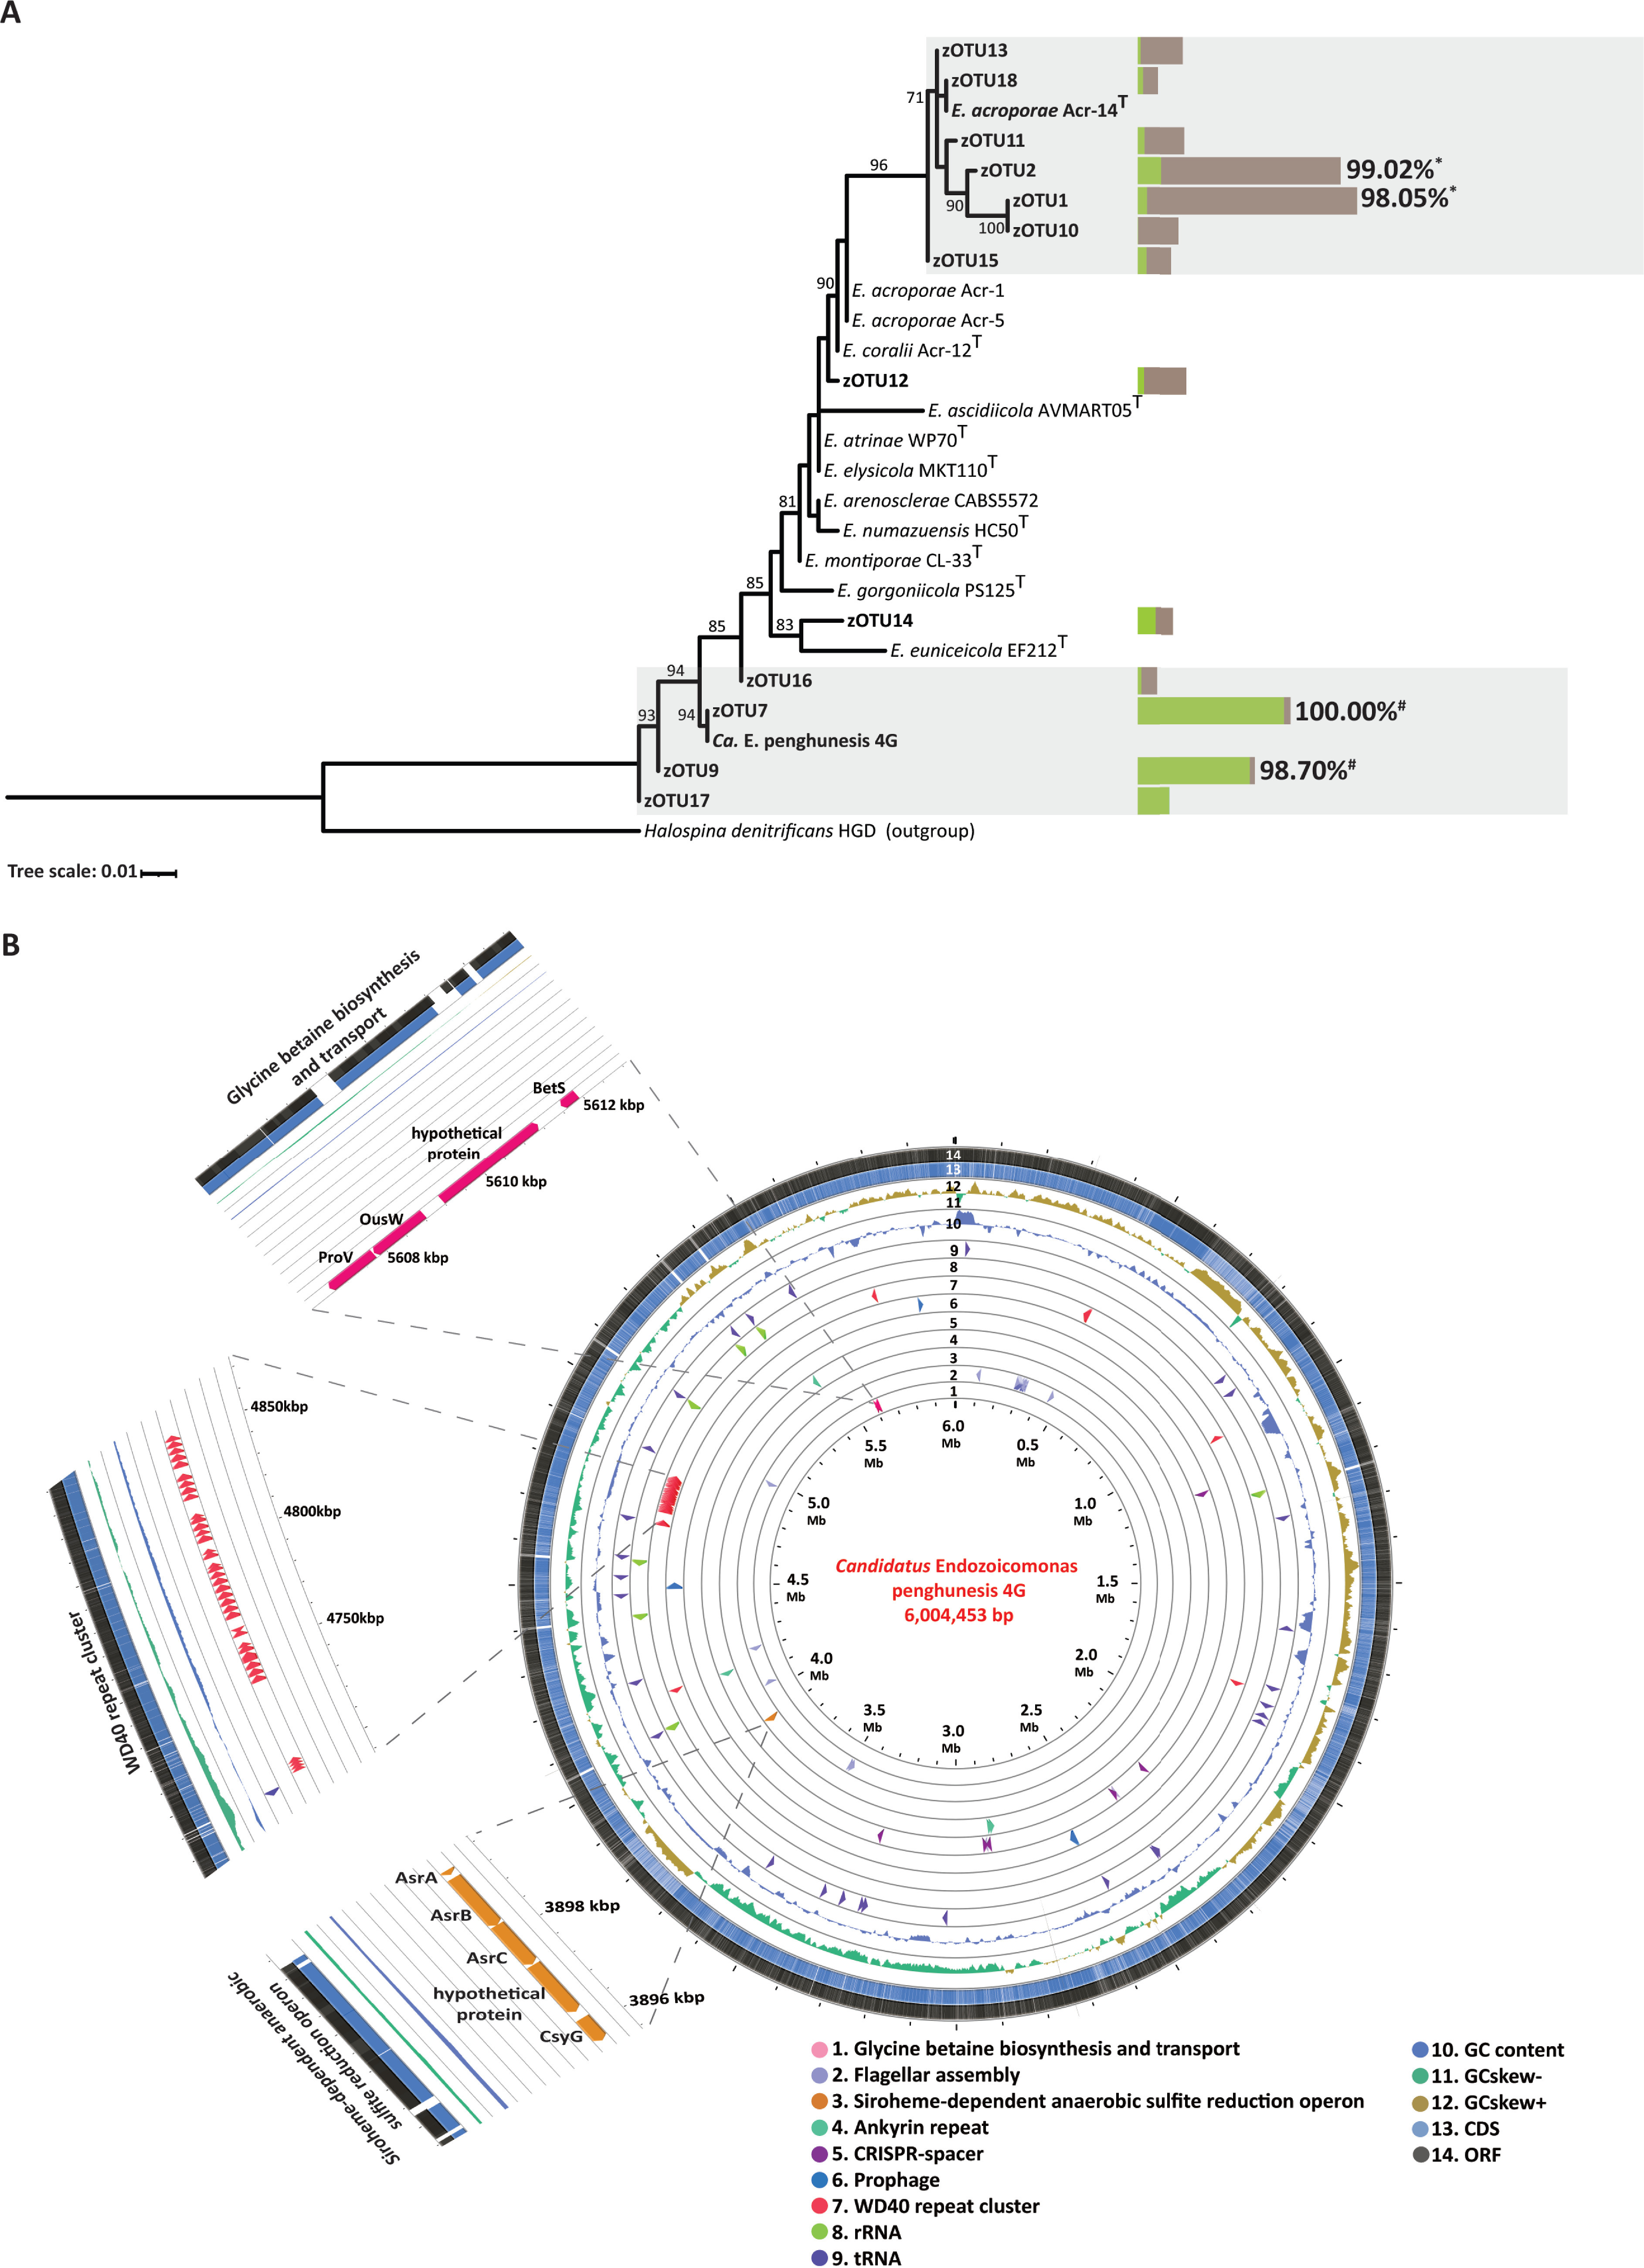
FIG 4.

Phylogenetic tree and genome map of “Candidatus Endozoicomonas penghunesis” 4G. (A) Phylogenetic tree of dominant zOTUs and 16S rRNA sequences of “Ca. Endozoicomonas penghunesis” (Copy1) and Endozoicomonas acroporae Acr-14T. Horizontal bars denote the relative abundance of selective zOTUs in the Inner (green) and Outer (brown) Bays. The percent values denote the percent identity between the zOTU and cultured 16S rRNA copy. #, “Ca. Endozoicomonas penghunesis”; *, E. acroporae Acr-14T. Shaded regions are considered to belong to one bacterial species. (B) Whole-genome map of “Ca. Endozoicomonas penghunesis” 4G drawn in CGViewer with concentric circles depicting distinct features. The map also highlights the concentration of WD40 domain proteins, Siroheme-dependent anaerobic sulfite reduction operon and glycine-betaine biosynthesis and transport pathways.
