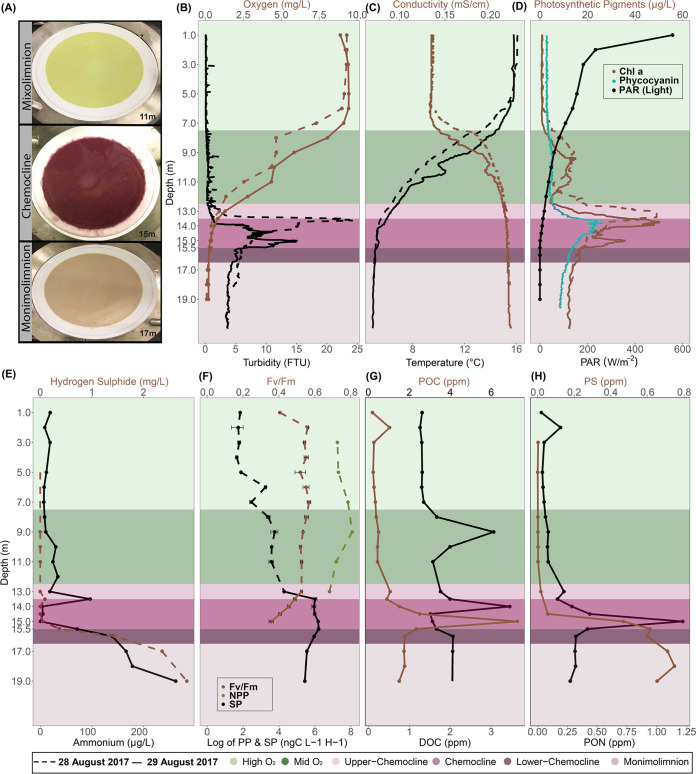
FIG 1.
Depth profiles of biogeochemical parameters of Lake Cadagno. Dashed and solid lines represent 28 and 29 August 2017, respectively. Standard deviations for each sample are indicated by horizontal bars. (A) Photographs of biomass collected on 0.22-μm (142-mm-diameter) filters from the Lake Cadagno mixolimnion, chemocline, and monimolimnion strata. (B to F) Depth profiles of oxygen and turbidity (B), conductivity and temperature (C), Chl a, phycocyanin, and photosynthetically active radiation (PAR) (D), hydrogen sulfide and ammonium concentrations (E), net primary production (NPP) and secondary production (SP) rates (F), particulate organic carbon (POC) and dissolved organic carbon (DOC) concentrations (G), and particulate sulfur (PS) and particulate organic nitrogen (PON) concentrations (H). In panels B to H, the high O2 mixolimnion, mid O2 mixolimnion, low O2 mixolimnion-chemocline transition zone, chemocline, lower-chemocline, and anoxic monimolimnion layers are indicated by light green, dark green, light lilac, lilac, dark lilac, and light brown backgrounds, respectively.

