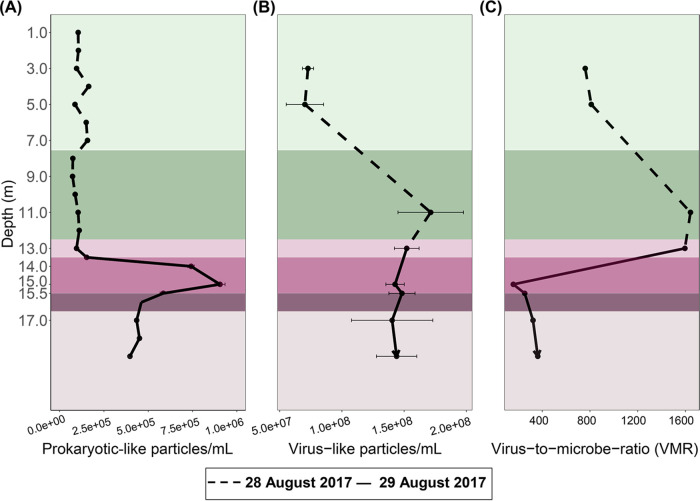
FIG 2.
Dashed and solid lines represent 28 and 29 August 2017, respectively. Standard deviations for each sample are indicated by horizontal bars. (A to C) Abundances of prokaryote-like particles (A) and free virus-like particles (B) from flow cytometry analyses and the virus-to-microbe ratio as VLP/PLP (C).

