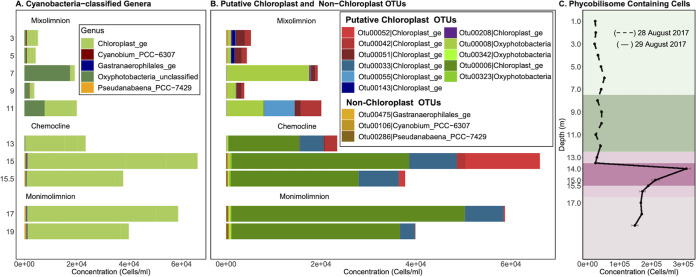
FIG 4.
Abundances and phylogenies of Lake Cadagno phytoplankton based on 16S rRNA gene amplicon sequencing and flow cytometry. Mixolimnion samples (0 to 11.0 m) were collected on day 1, and chemocline and monimolimnion samples (12.0 to 19.0 m) were collected on day 2. Abundances in panels B and C are acquired by scaling 16S rRNA gene read counts by FCM cell counts. (A and B) Inferred concentrations (cells/mL) of OTUs were assigned to the phylum Cyanobacteria, and of those, the inferred concentrations (cells/mL) of OTUs were classified as putative chloroplasts and non-chloroplasts at the genus level (B). (C) Depth profile of phycobilin-containing cell counts based on flow cytometry with a 640-nm laser. The high O2 mixolimnion, mid O2 mixolimnion, low O2 mixolimnion-chemocline transition zone, chemocline, lower-chemocline, and anoxic monimolimnion layers are indicated by light green, dark green, light lilac, lilac, dark lilac, and light brown backgrounds, respectively.

