FIG 6.
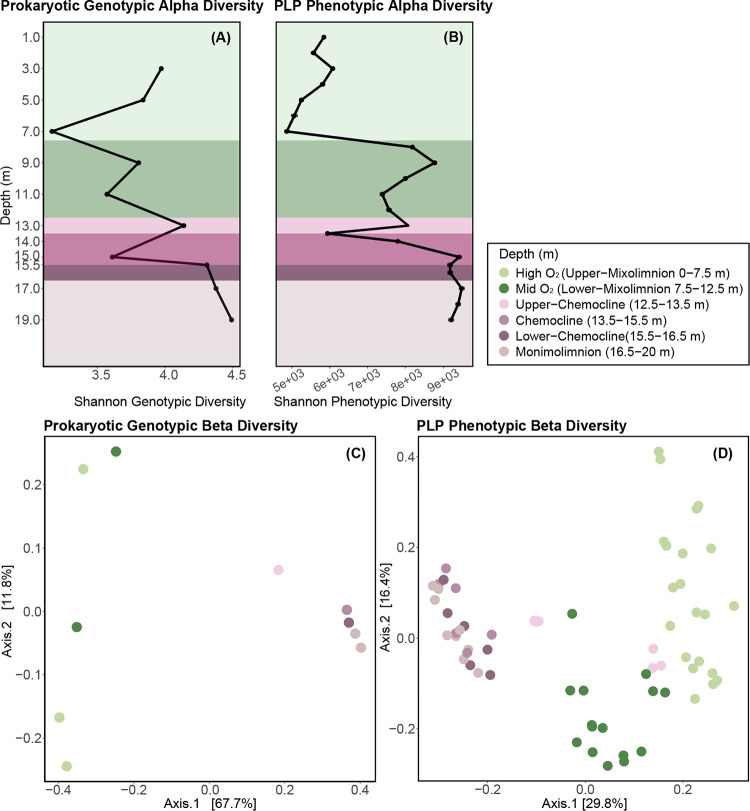
Trends in microbial community genotypic (16S rRNA gene amplicon sequencing, including prokaryotic and chloroplast-related OTUs) and phenotypic (PLP features based on flow cytometry [44]) alpha and beta diversity in Lake Cadagno. (A) Variation in genotypic alpha diversity (Shannon) with depth. (B) Variation in PLP phenotypic alpha diversity (Shannon). Mixolimnion samples (0 to 11.0 m) were collected on day 1, and chemocline and monimolimnion samples (12.0 to 19.0 m) were collected on day 2. Colors of data points represent the depth strata sampled. (C) PCoA represents the genotypic beta diversity dissimilarity (Bray-Curtis distance) of microbial communities. (D) PCoA represents the phenotypic beta diversity dissimilarity (Bray-Curtis distance) of microbial communities.

