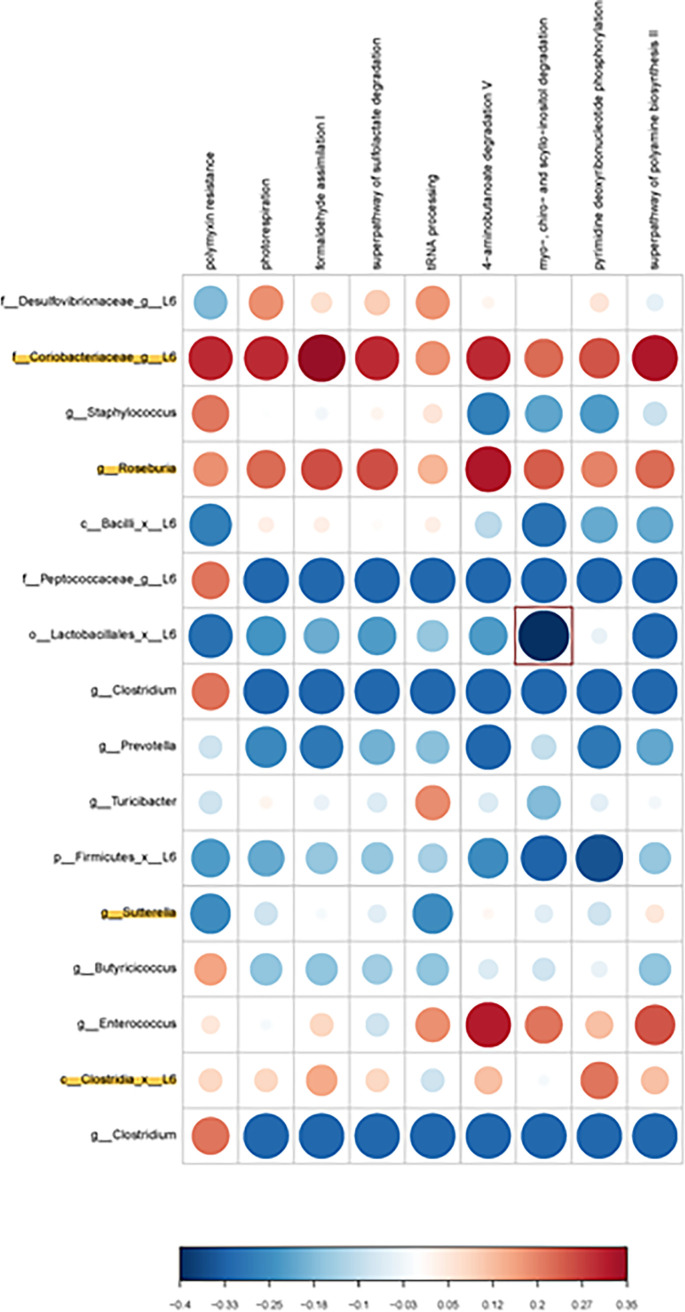
FIG 5.
Bacterial metabolic and other pathway differences in the fecal microbiome of OXY exposed males versus CTL males. As described in Fig. 7 of Ma et al. (51), correlations between the PICRUSt-generated functional profile and QIIME II-generated genus level bacterial abundance were calculated and plotted against treatment group. Those genera that were identified by MetagenomeSeq as being different between the two groups are depicted. Bacteria that are highlighted had increased relative amounts in OXY exposed group. Metabolic pathway designations are delineated at the top of the figure. Shading intensity and size of the circles indicates the Kendall rank correlation coefficient between matrices. Red indicates a positive correlation, whereas blue designates a negative correlation. Red squares surrounding the circles are indicative of a P value ≤ 0.05, although none were present for this comparison. Legend for the quantitative scores associated with the range of blue to red colors is listed below the figure. Legend for the scores associated with the range of blue to red colors is listed below the figure.

