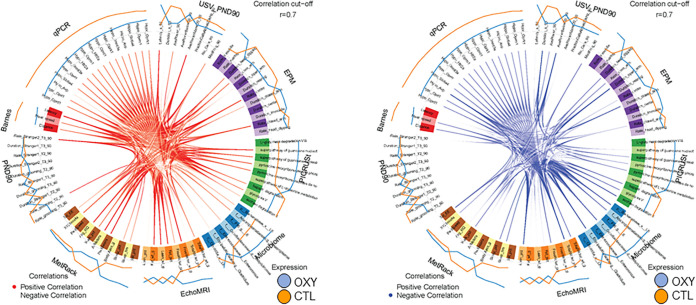
FIG 6.
Circos plot correlations between gut bacterial, metabolites, and behavioral and metabolic parameters in OXY exposed females versus CTL females. Red lines in the center indicate a positive correlation. In contrast, blue lines indicate a negative correlation. Results for CTL (SAL) females are indicated with an orange line outside the circle. Blue line indicates results for OXY females. The color of the line further from the circle indicates the group where these results are greater.

