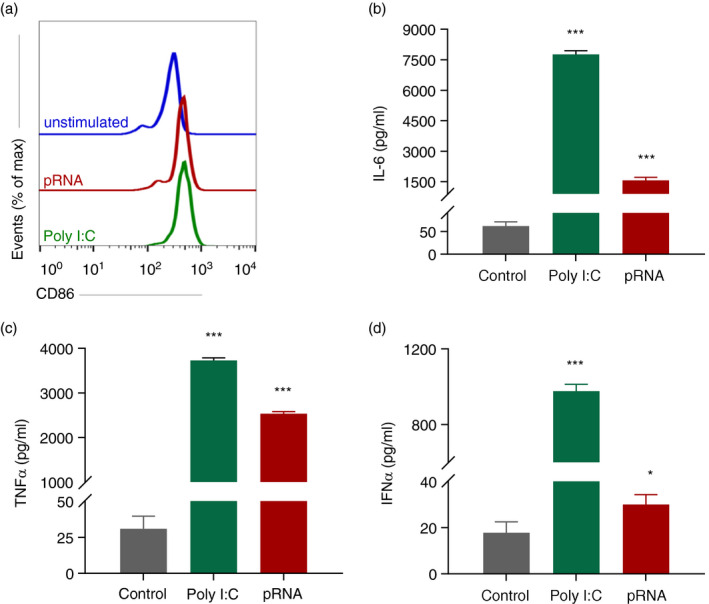
FIGURE 1.

Poly I:C and pRNA activate cDC1. (a) Flow cytometry histograms of CD86 cDC1 stimulated cells for 12 h. (b–d) Cytokines levels on protein level were measured in the supernatant of the cDC1 stimulated for 12 h. Data represent mean ± SEM of three independent experiments. *p < 0·05; ***p < 0·001 (Student's t‐test)
