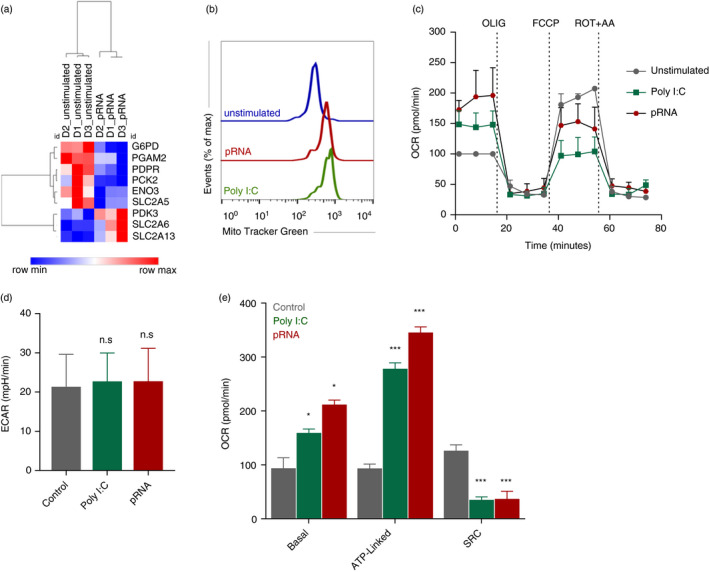
FIGURE 2.

TLR stimulation induces OXPHOS in cDC1. (a) Heatmap showing expression of significantly changed genes which regulate glycolysis in cDC1 upon pRNA‐stimulation for 12 h. Red colour indicates increased expression while blue colour shows decreased expression. (b) Flow cytometry histograms of cDC1 cells stained with MitoTracker Green FM and stimulated with poly I:C or pRNA for 12 h. (c) Mitochondrial fitness test of cDC1 stimulated with poly I:C or pRNA for 12 h. Data represent mean ± SEM of three independent experiments. (d–e) Data were collected within same experiments as c, but are shown separately for better understanding. Data represent mean ± SEM of three independent experiments. *p < 0·05; ***p < 0·001 (Student's t‐test) [Colour figure can be viewed at wileyonlinelibrary.com]
