FIGURE 4.

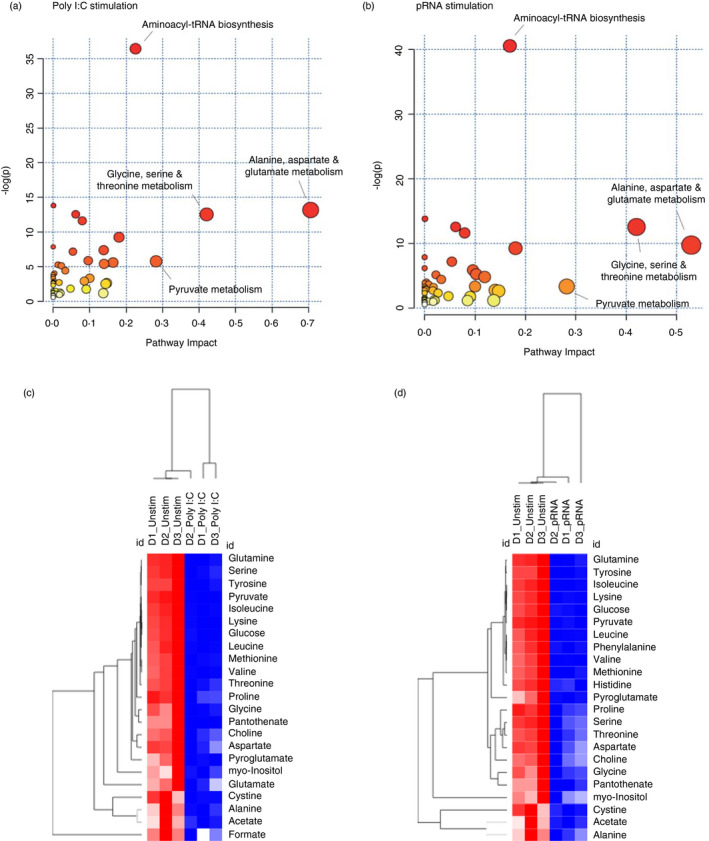
TLR stimulation alters amino acid metabolism in cDC1. (a) Metabolome view from pathway analysis performed using MetaboAnalyst in cDC1 upon poly I:C stimulation. Select pathways with high pathway impact and/or high p‐value are labelled. (b) Metabolome view from pathway analysis performed using MetaboAnalyst in cDC1 upon pRNA stimulation. Select pathways with high pathway impact and/or high p‐value are labelled. (c) Heatmap showing levels of significantly changed metabolites which regulate amino acid metabolism in cDC1 upon poly I:C stimulation for 12 h. Red colour indicates higher levels while blue colour shows lower levels. (d) Heatmap showing levels of significantly changed metabolites which regulate amino acid metabolism in cDC1 upon pRNA‐stimulation for 12 h. Red colour indicates increased levels while blue colour shows decreased levels [Colour figure can be viewed at wileyonlinelibrary.com]
