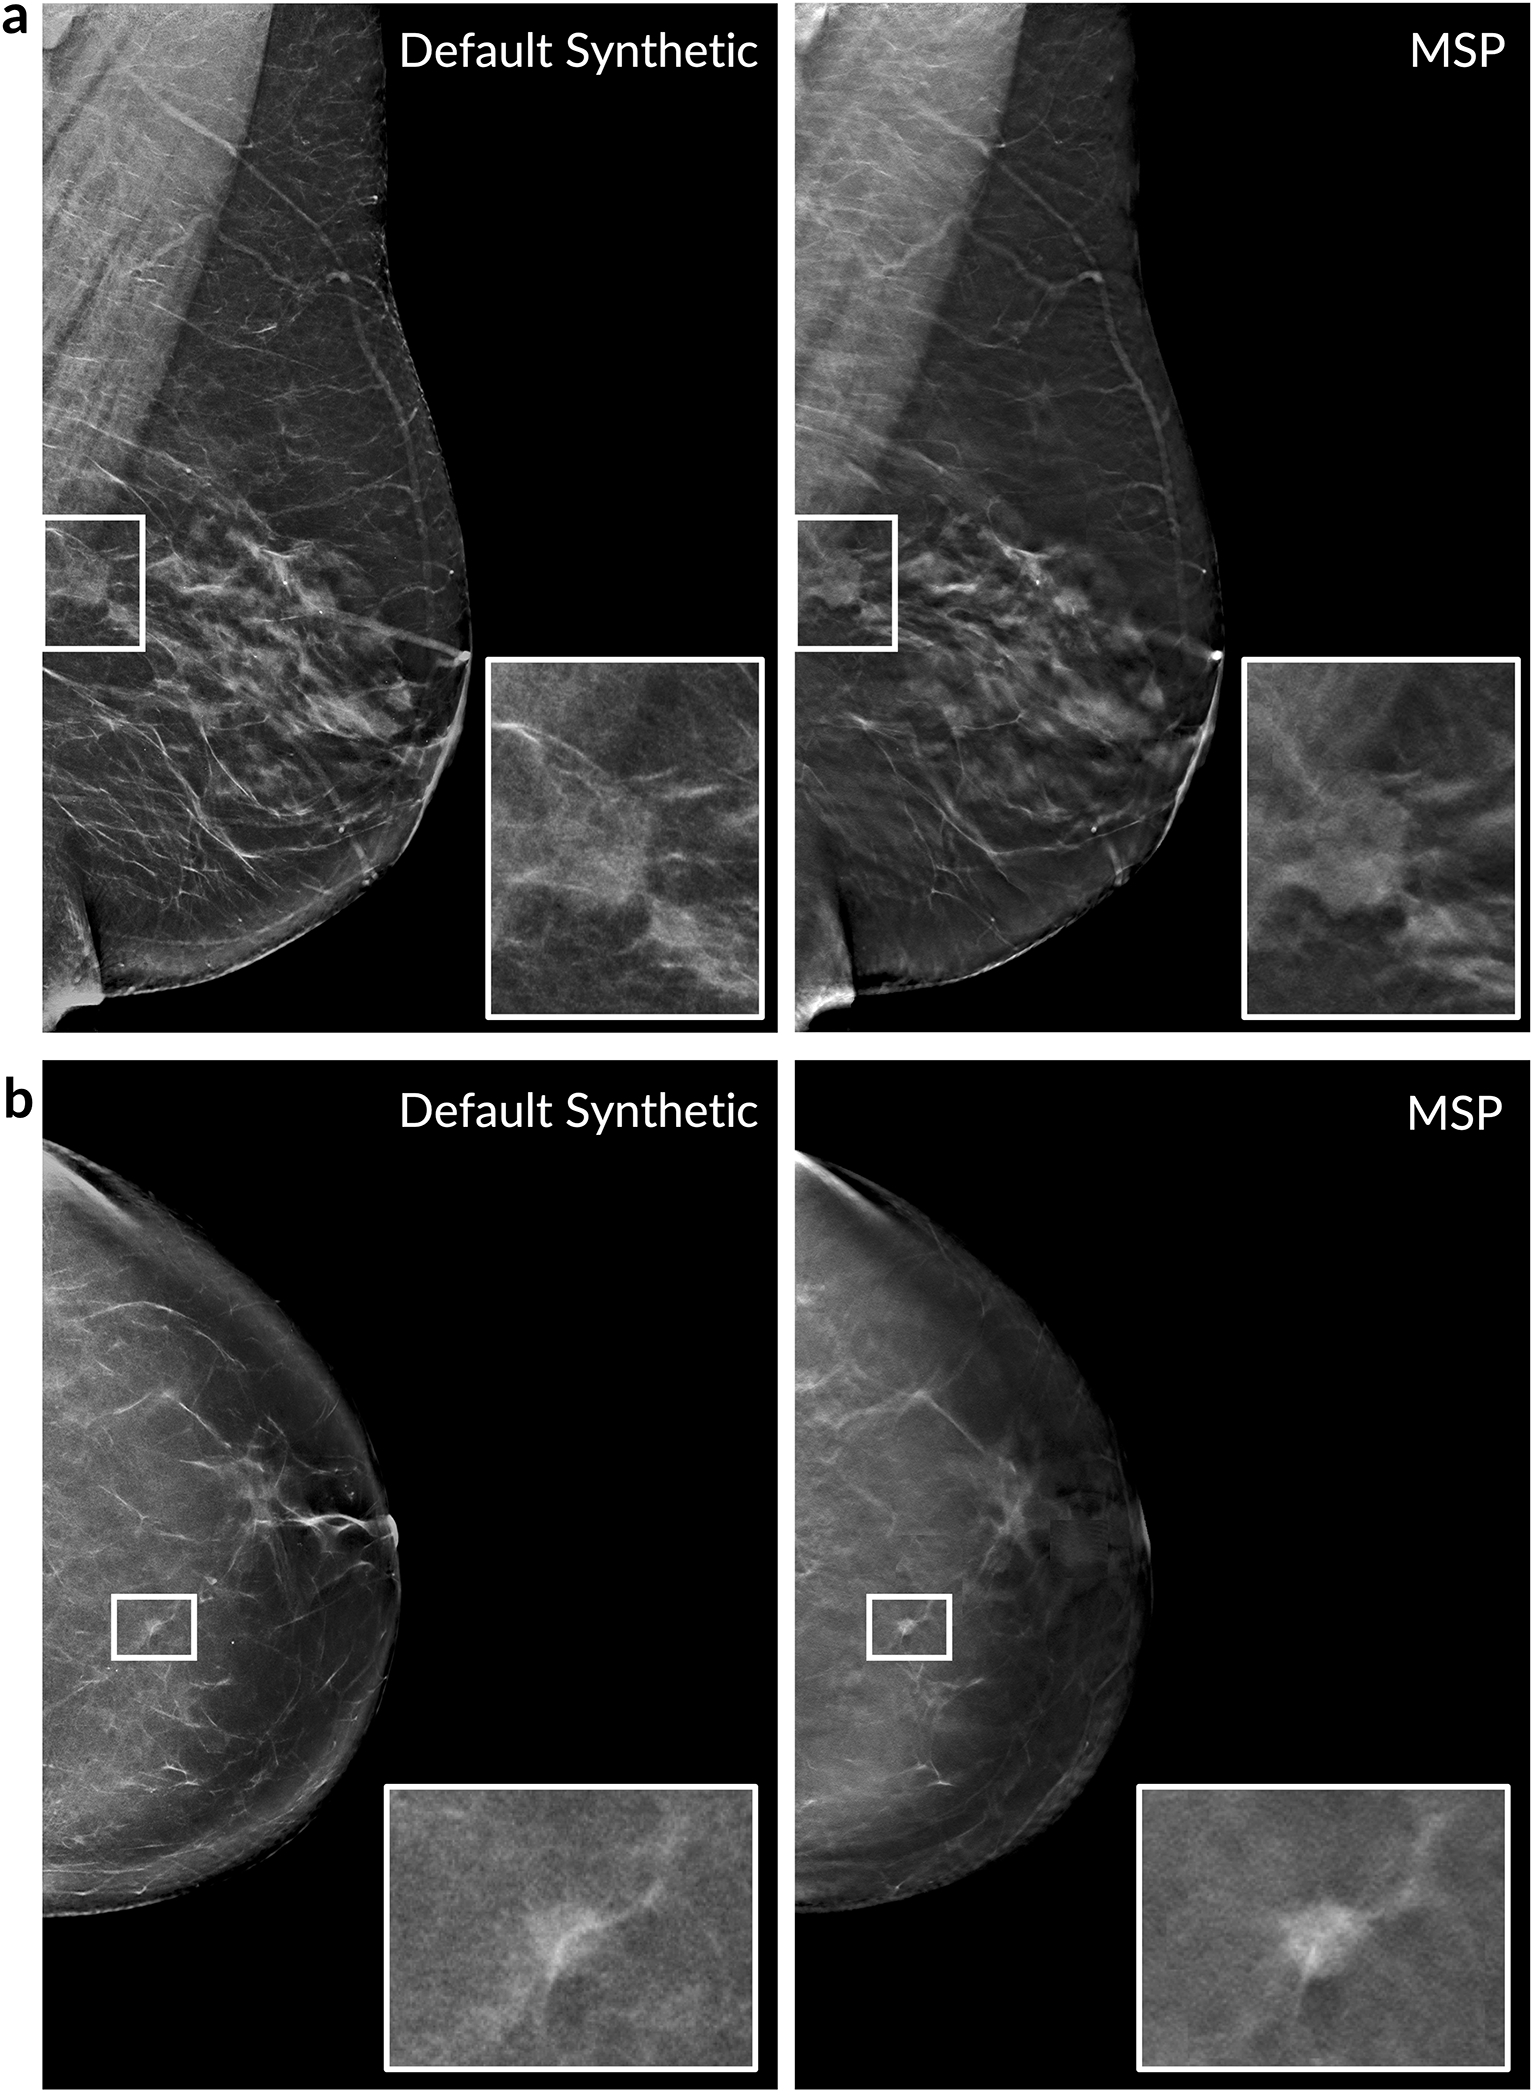
Extended Data Figure 10: Examples of maximum suspicion projection (MSP) images.

Two cancer cases are presented. Left column: Default 2D synthetic images. Right column: MSP images. The insets highlight the malignant lesion. In both cases, the deep learning algorithm scored the MSP image higher for the likelihood of cancer (a: 0.77 vs. 0.14, b: 0.87 vs. 0.31). We note that the deep learning algorithm correctly localized the lesion in both of the MSP images as well.
