
Figure 2: Reader study results.
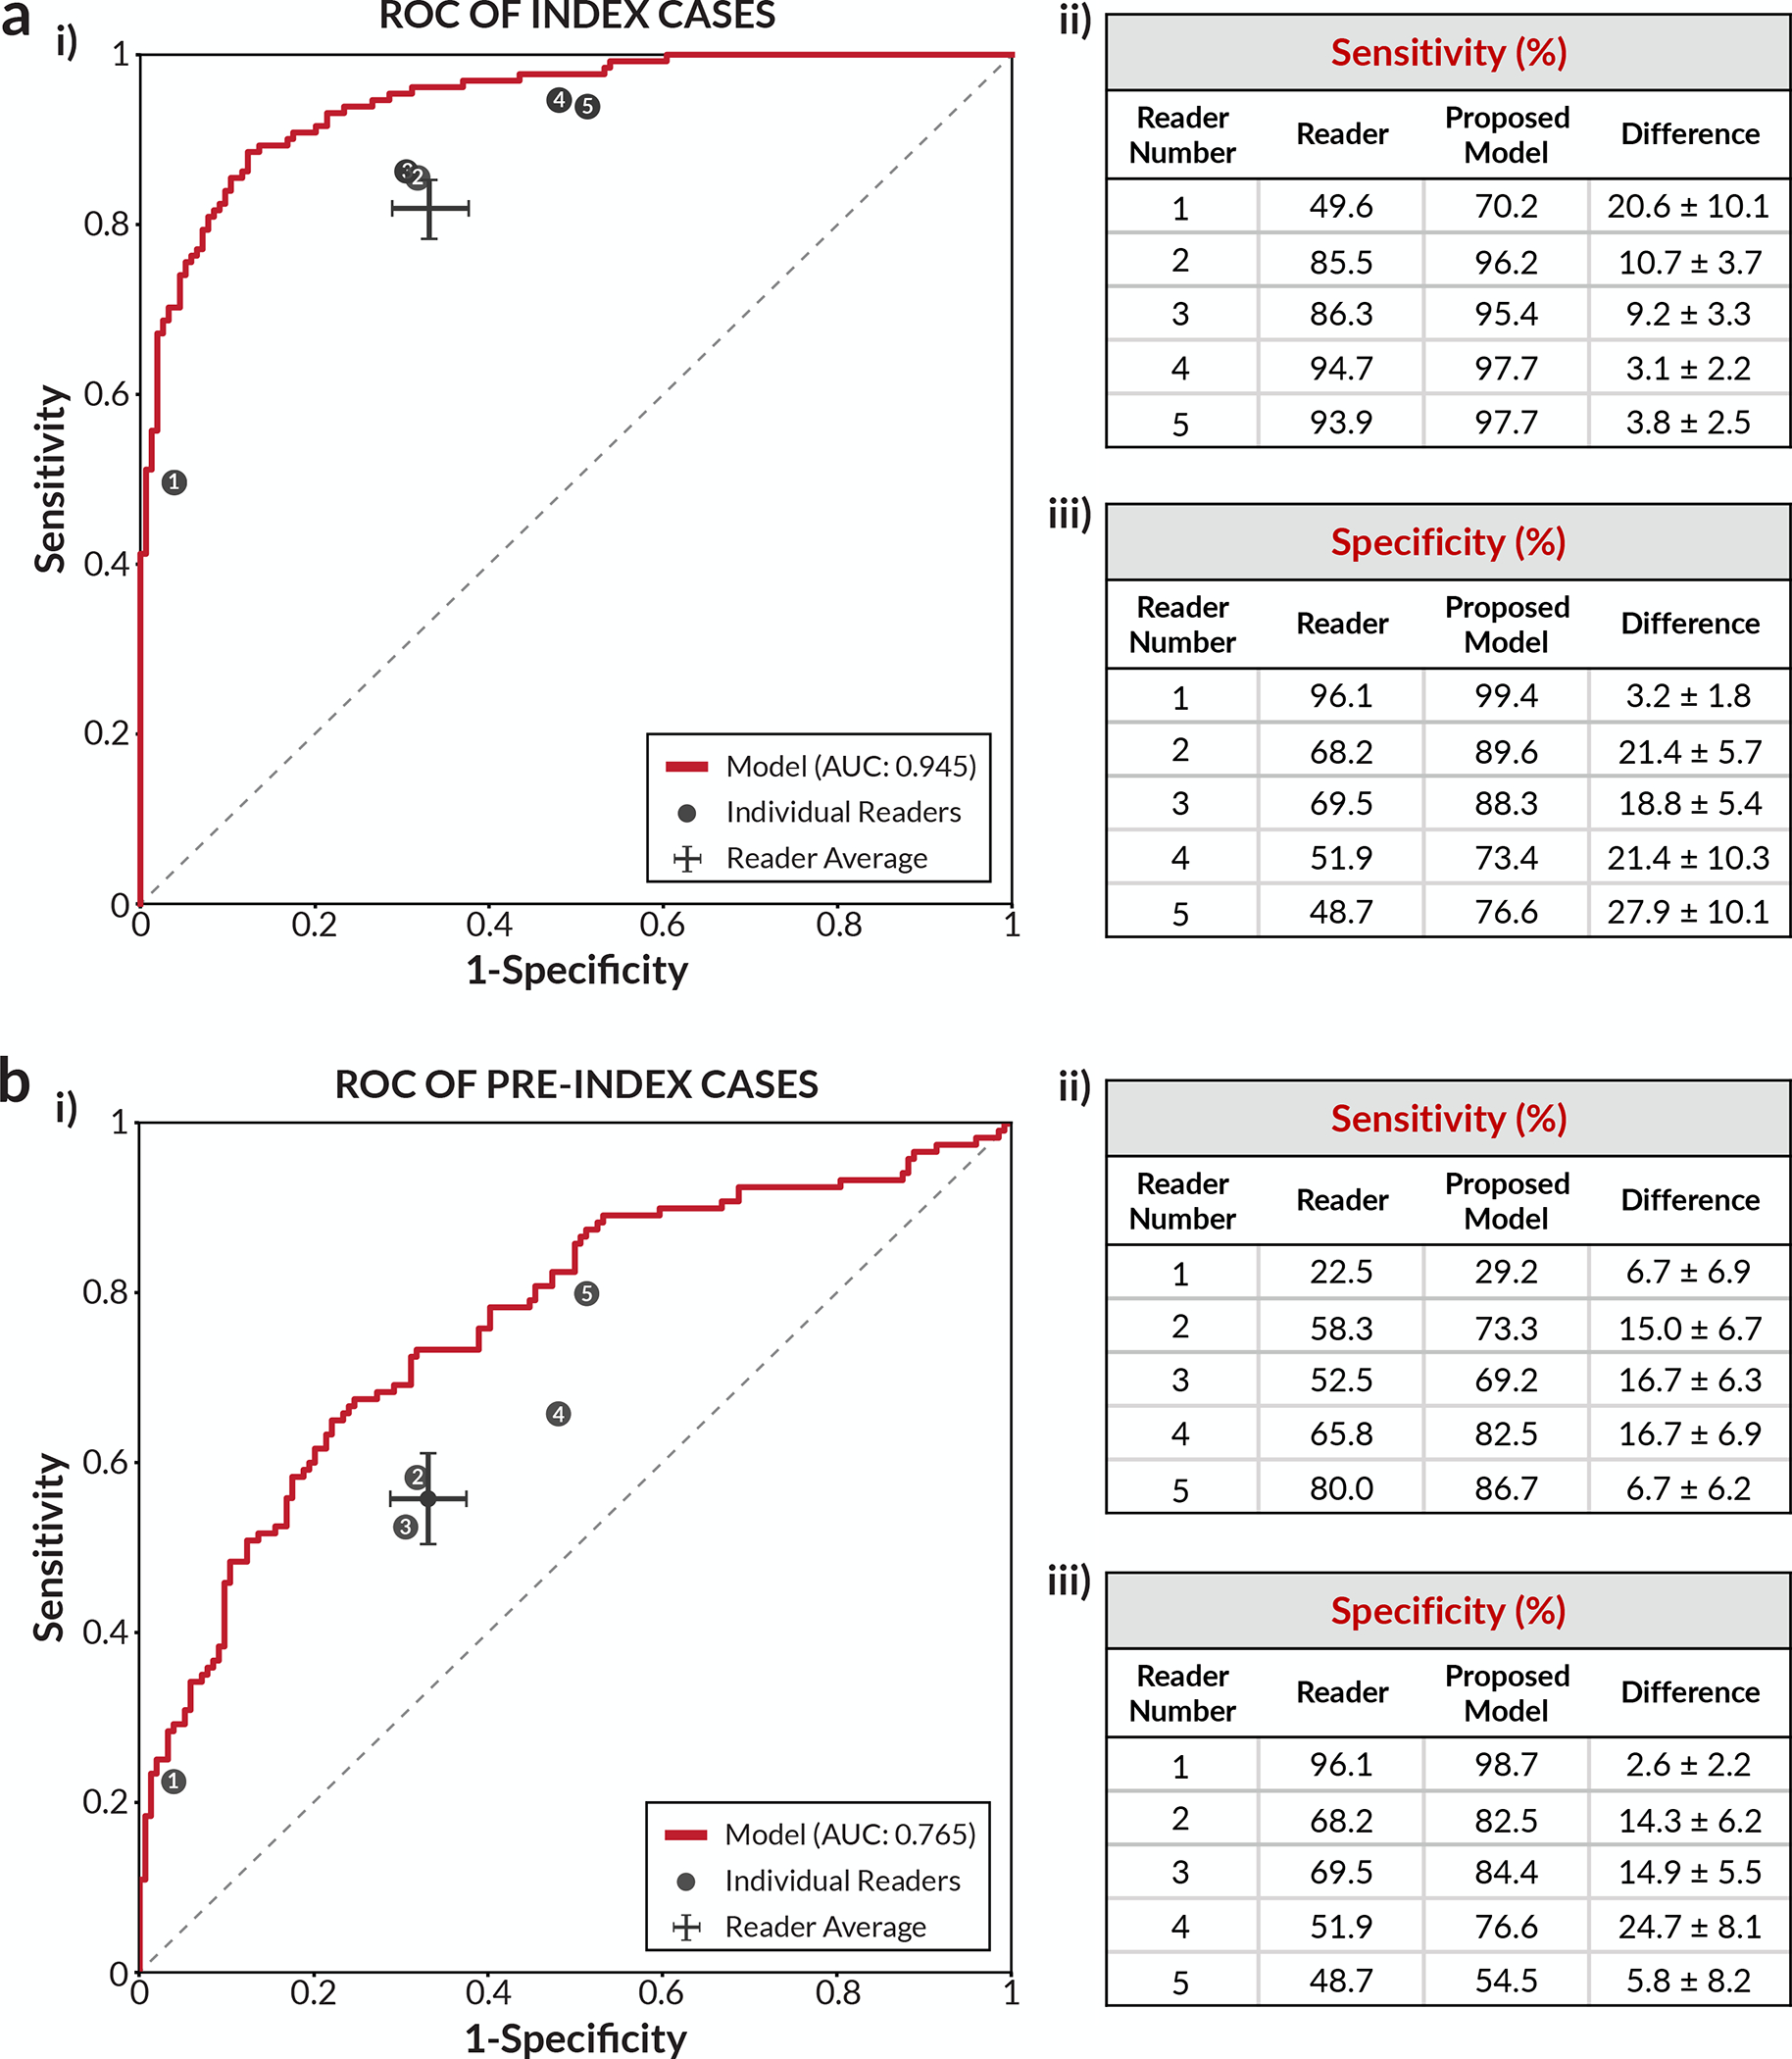
a) Index cancer exams & confirmed negatives. i) The proposed deep learning model outperformed all five radiologists on the set of 131 index cancer exams and 154 confirmed negatives. Each data point represents a single reader, and the ROC curve represents the performance of the deep learning model. The cross corresponds to the mean radiologist performance with the lengths of the cross indicating 95% confidence intervals. ii) Sensitivity of each reader and the corresponding sensitivity of the proposed model at a specificity chosen to match each reader. iii) Specificity of each reader and the corresponding specificity of the proposed model at a sensitivity chosen to match each reader. b) Pre-index cancer exams & confirmed negatives. i) The proposed deep learning model also outperformed all five radiologists on the early detection task. The dataset consisted of 120 pre-index cancer exams - which are defined as mammograms interpreted as negative 12–24 months prior to the index exam in which cancer was found - and 154 confirmed negatives. The cross corresponds to the mean radiologist performance with the lengths of the cross indicating 95% confidence intervals. ii) Sensitivity of each reader and the corresponding sensitivity of the proposed model at a specificity chosen to match each reader. iii) Specificity of each reader and the corresponding specificity of the proposed model at a sensitivity chosen to match each reader. For the sensitivity and specificity tables, the standard deviation of the model minus reader difference was calculated via bootstrapping.