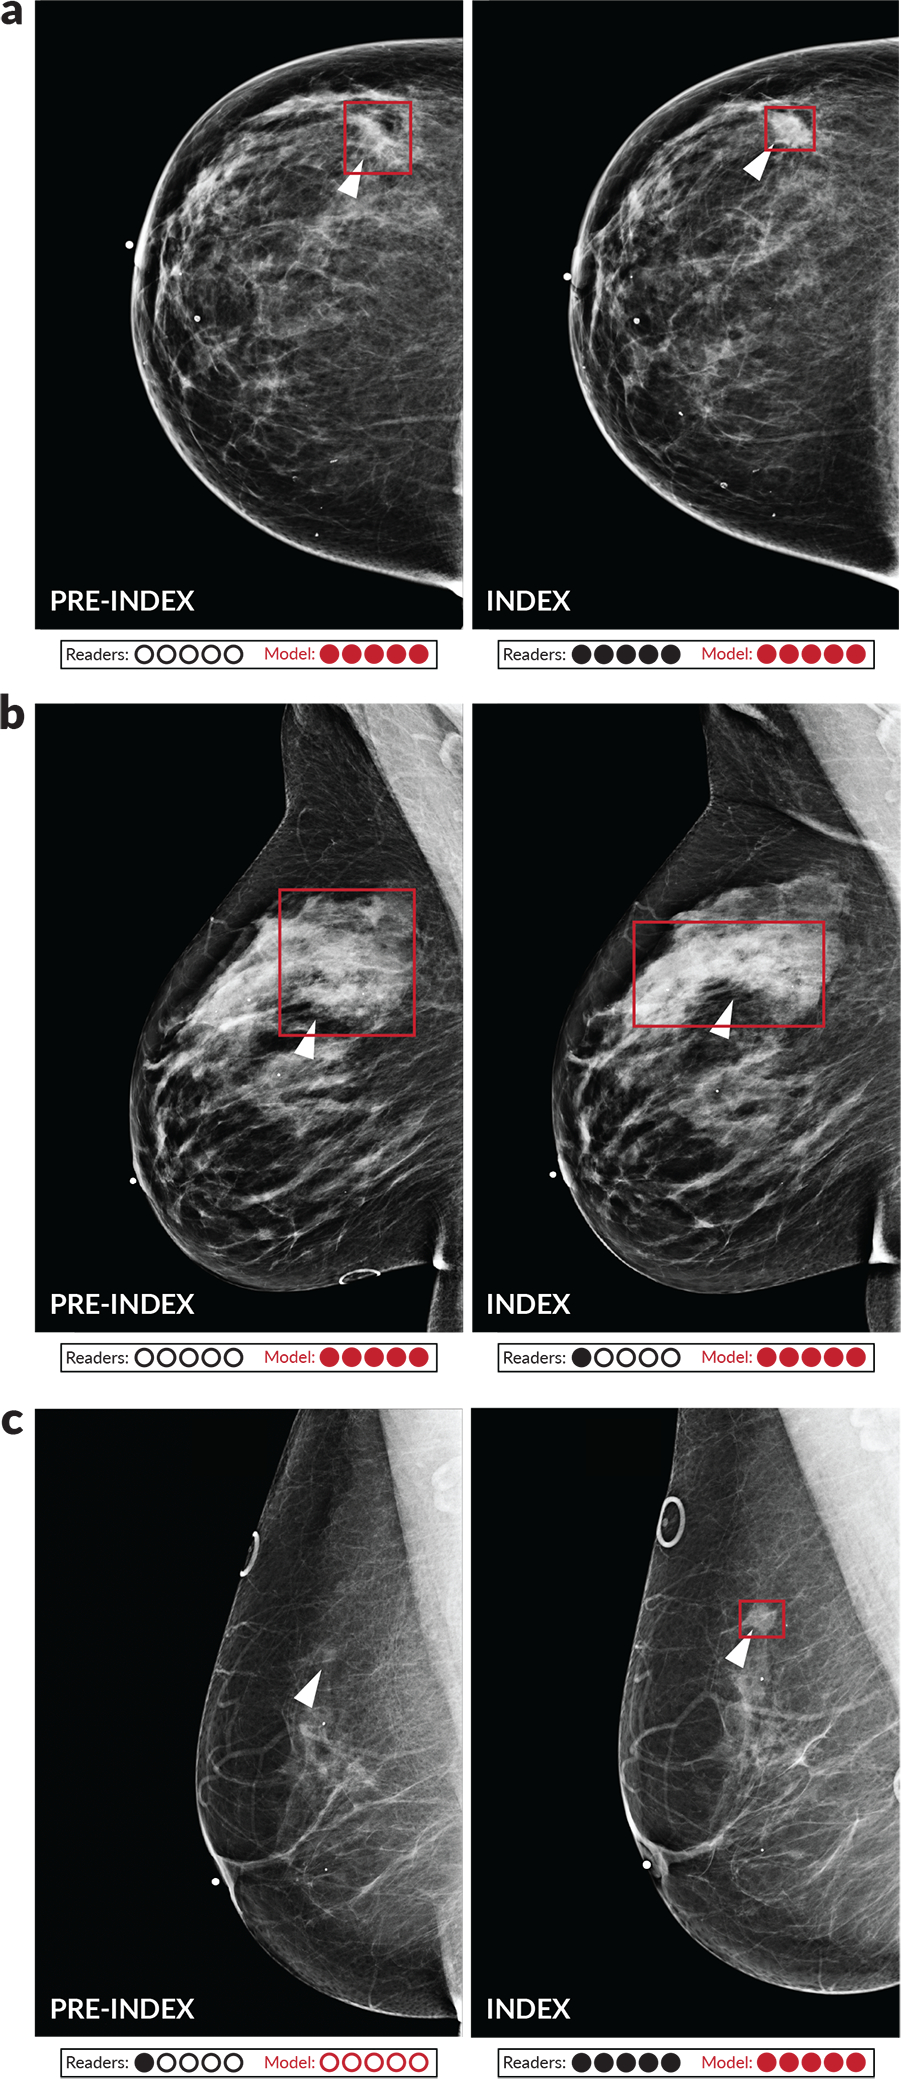
Figure 3: Examples of index and pre-index cancer exam pairs.

Images from three patients with biopsy-proven malignancies are displayed. For each patient, an image from the index exam from which the cancer was discovered is shown on the right, and an image from the prior screening exam acquired 12–24 months earlier and interpreted as negative is shown on the left. From top to bottom, the number of days between the index and pre-index exams is 378, 629, and 414. The dots below each image indicate reader and model performance. Specifically, the number of infilled black dots represent how many of the five readers correctly classified the corresponding case and the number of infilled red dots represent how many times the model would correctly classify the case if the model score threshold was individually set to match the specificity of each reader. The model is thus evaluated at five binary decision thresholds for comparison purposes, and we note that a different binary score threshold may be used in practice. Red boxes on the images indicate the model’s bounding box output. White arrows indicate the location of the malignant lesion. a) A cancer that was correctly classified by all readers and the deep learning model at all thresholds in the index case, but only detected by the model in the pre-index case. b) A cancer that was detected by the model in both the pre-index and index case, but only detected by one reader in the index case and zero readers in the pre-index case. c) A cancer that was detected by the readers and the model in the index case, but only detected by one reader in the pre-index case. The absence of a red bounding box indicates that the model did not detect the cancer.
