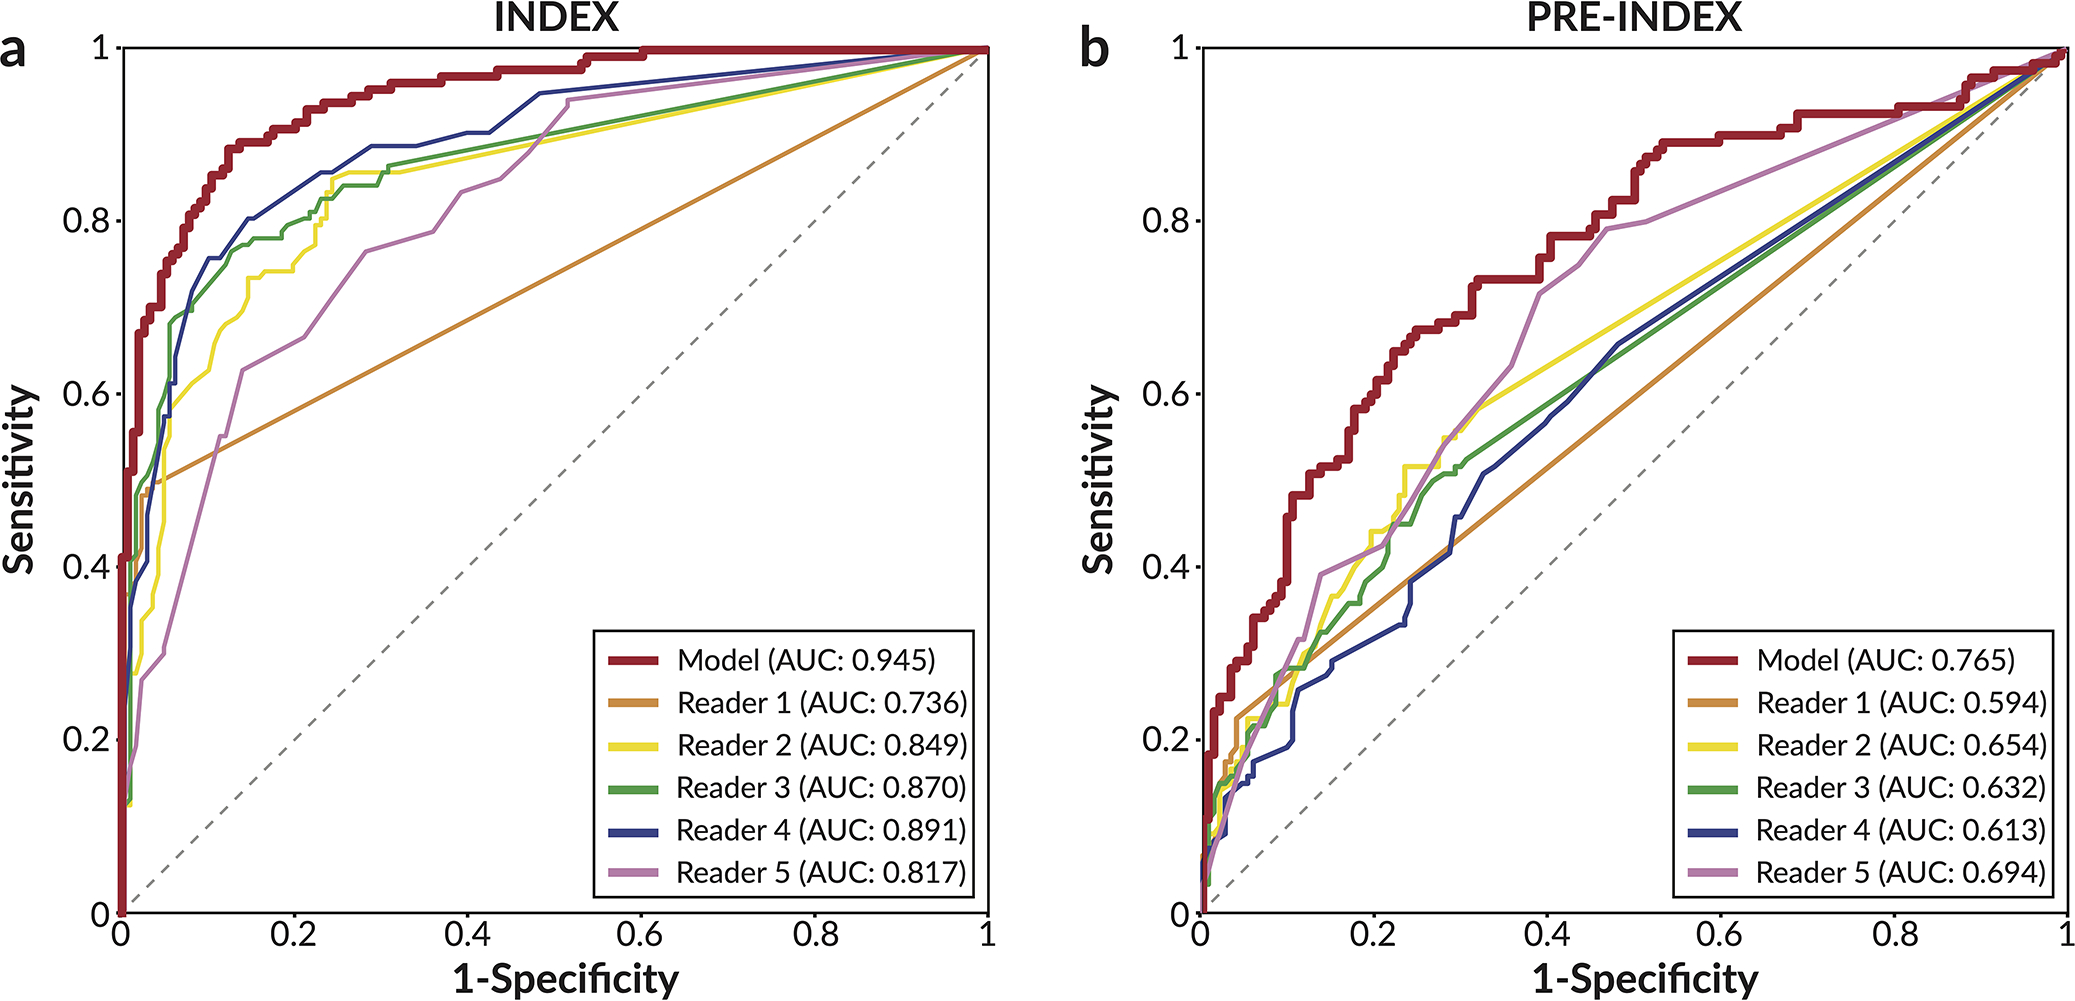
Extended Data Figure 1: Reader ROC curves using Probability of Malignancy metric.

For each lesion deemed suspicious enough to warrant recall, readers assigned a 0–100 probability of malignancy (POM) score. Cases not recalled were assigned a score of 0. a) ROC curve using POM on the 131 index cancer cases and 154 confirmed negatives. In order of reader number, the reader AUCs are 0.736±0.023, 0.849±0.022, 0.870±0.021, 0.891±0.019, and 0.817±0.025. b) ROC curve using POM on the 120 pre-index cancer cases and 154 confirmed negatives. In order of reader number, the reader AUCs are 0.594±0.021, 0.654±0.031, 0.632±0.030, 0.613±0.033, and 0.694±0.031. The standard deviation for each AUC value was calculated via bootstrapping.
