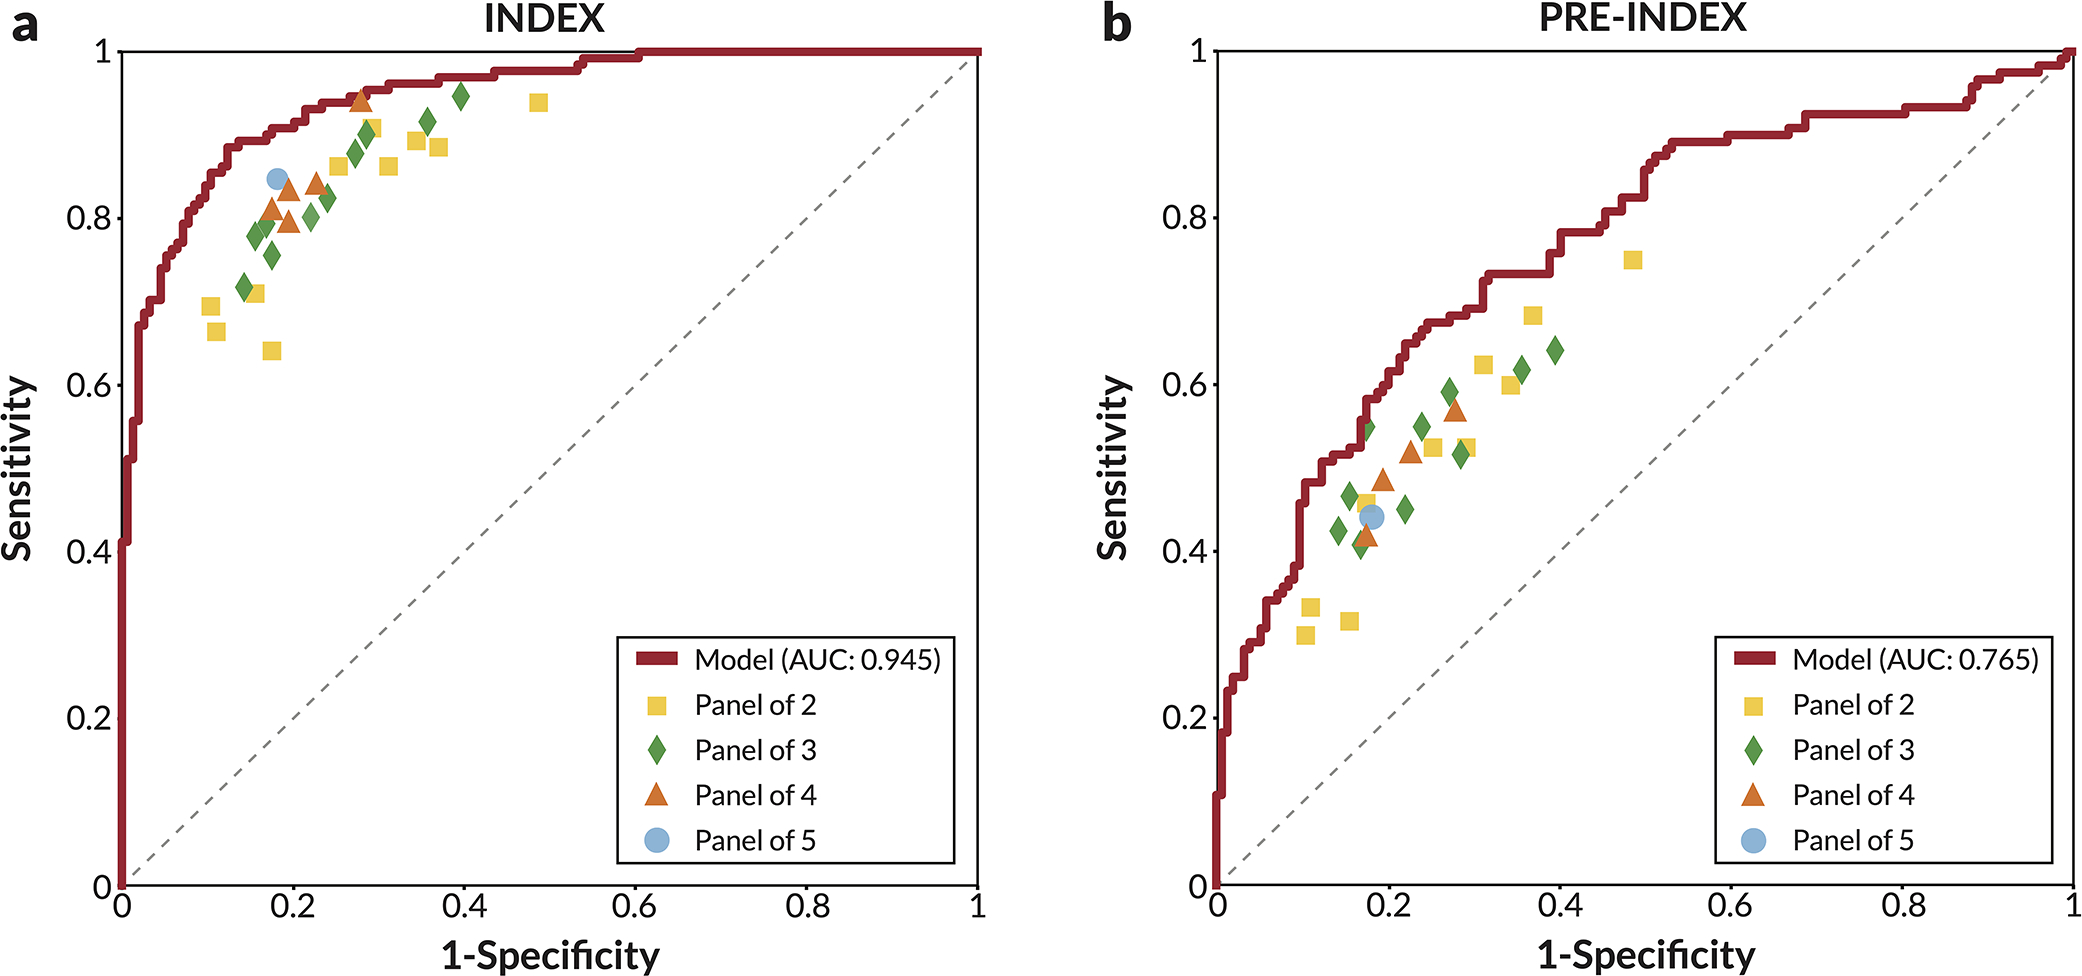
Extended Data Figure 2: Results of model compared to synthesized panel of readers.

Comparison of model ROC curves to every combination of 2, 3, 4, and 5 readers. Readers were combined by averaging BIRADS scores, with sensitivity and specificity calculated using a threshold of 3. On both the (a) index cancer exams and (b) pre-index cancer exams, the model outperformed every combination of readers, as indicated by each combination falling below the model’s respective ROC curve. The reader study dataset consists of 131 index cancer exams, 120 pre-index cancer exams, and 154 confirmed negatives.
