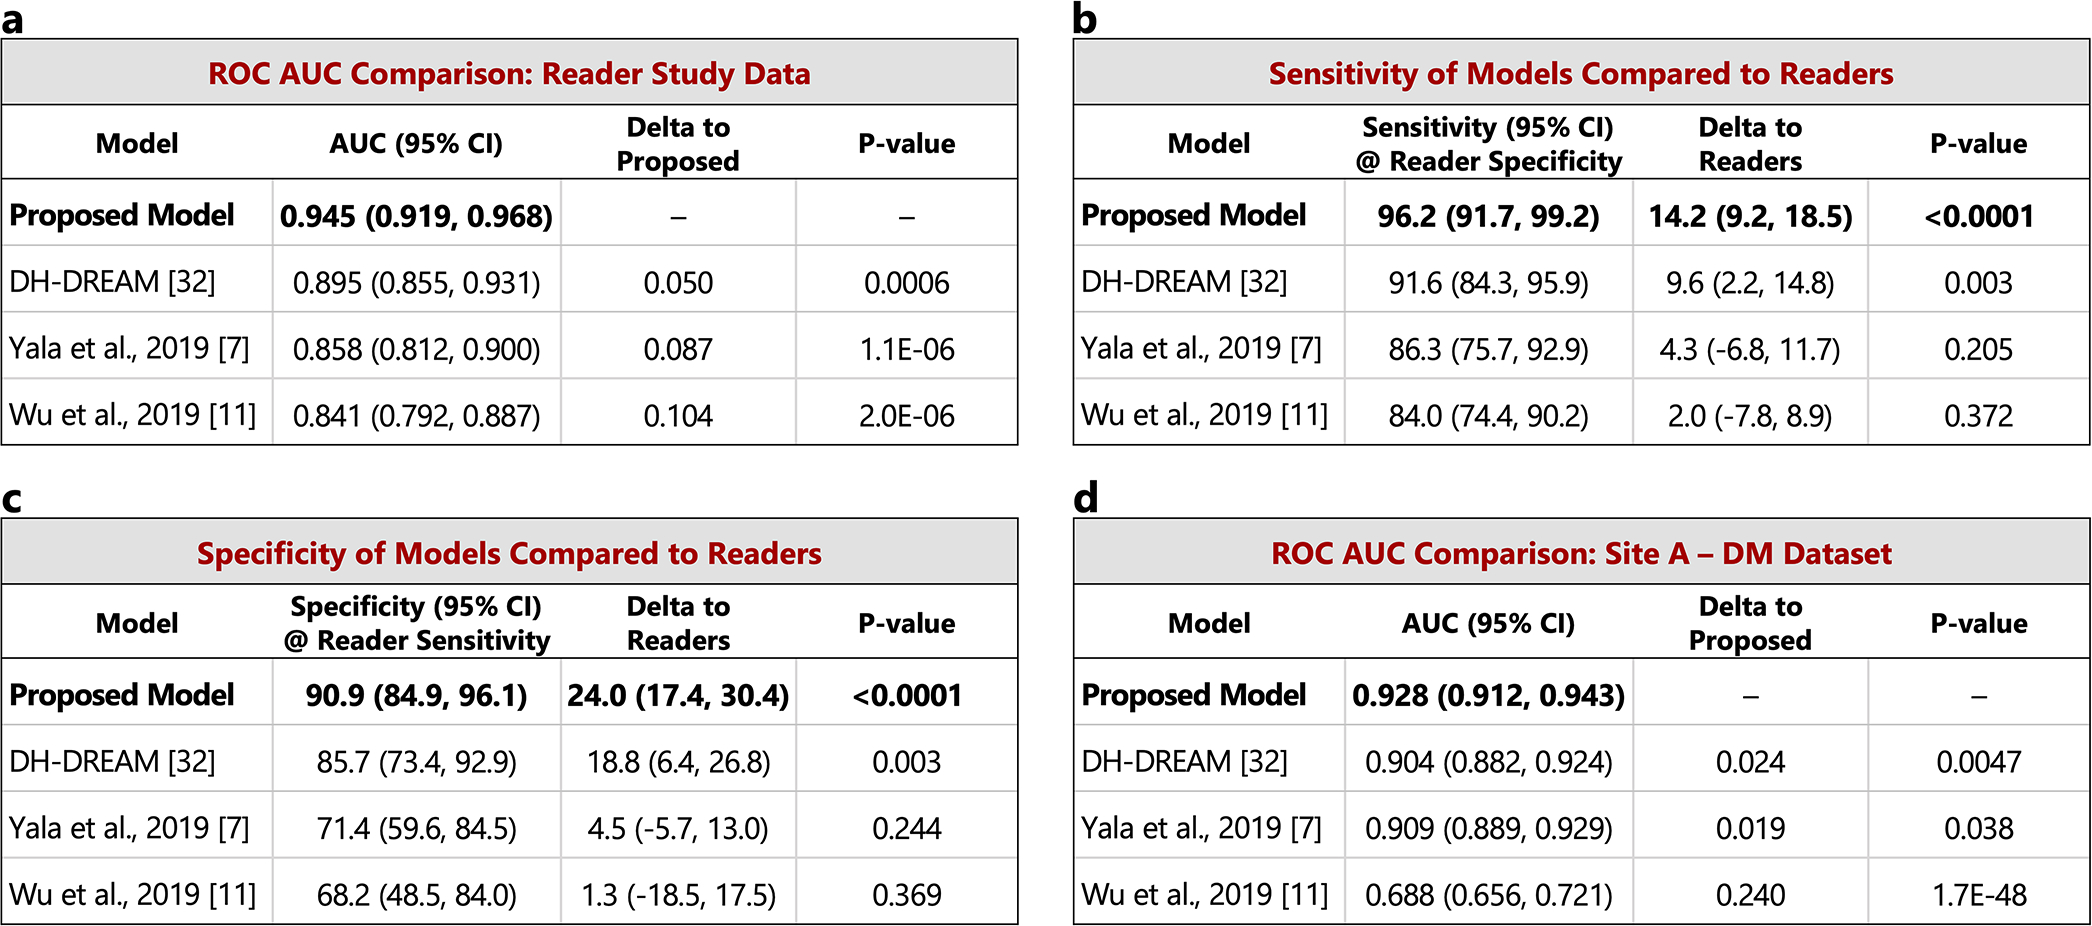
Extended Data Figure 3: Comparison to recent work – index cancer exams.

The performance of the proposed model is compared to other recently published models on the set of index cancer exams and confirmed negatives from our reader study (a-c) and the “Site A - DM dataset” (d). P-values for AUC differences were calculated using the DeLong method [45] (two sided). Confidence intervals for AUC, sensitivity, and specificity were computed via bootstrapping. a) ROC AUC comparison: Reader study data (Site D). The Site D dataset contains 131 index cancer exams and 154 confirmed negatives. The DeLong method z-values corresponding to the AUC differences are, from top to bottom, 3.44, 4.87, and 4.76. b) Sensitivity of models compared to readers. Sensitivity was obtained at the point on the ROC curve corresponding to the average reader specificity. Delta values show the difference between model sensitivity and average reader sensitivity and the p-values correspond to this difference (computed via bootstrapping). c) Specificity of models compared to readers. Specificity was obtained at the point on the ROC curve corresponding to the average reader sensitivity. Delta values show the difference between model specificity and average reader specificity and the p-values correspond to this difference (computed via bootstrapping). d) ROC AUC comparison: Site A - DM dataset. Compared to the original dataset, 60 negatives (0.78% of the negatives) were excluded from the comparison analysis because at least one of the models were unable to successfully process these studies. All positives were successfully processed by all models, resulting in 254 index cancer exams and 7,637 confirmed negatives for comparison. The DeLong method z-values corresponding to the AUC differences are, from top to bottom, 2.83, 2.08, and 14.6.
