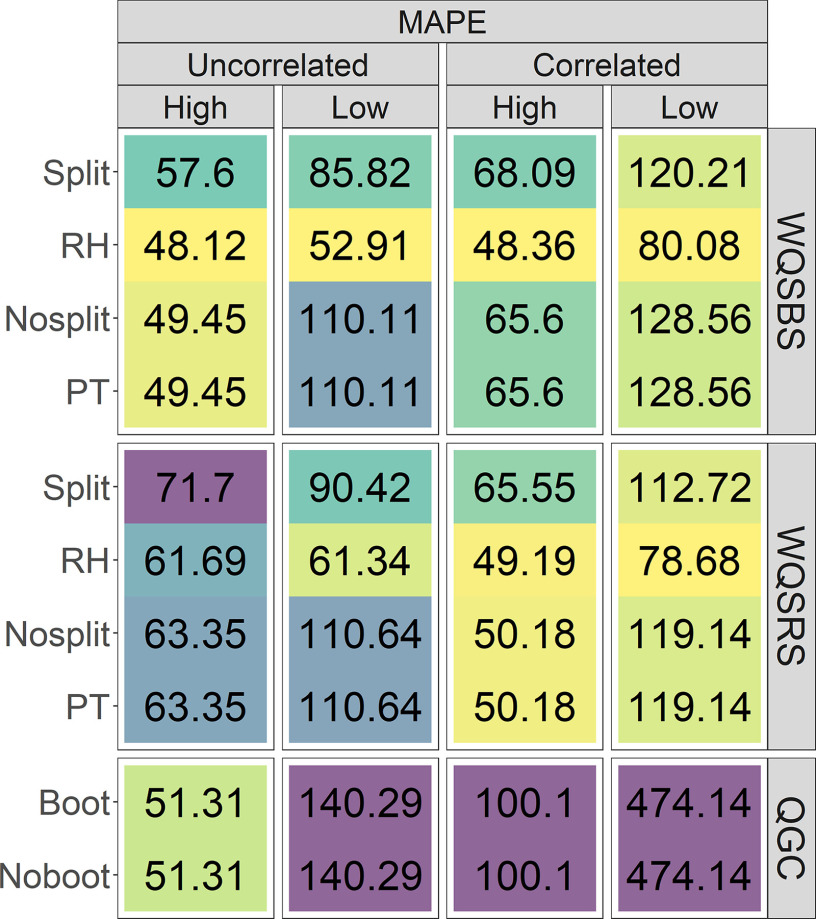
Figure 2.
MAPE for high and low mixture weight estimates rescaled as component-specific coefficients in 500 simulations for nonzero mixture coefficients between correlation conditions. Within each simulation exposure correlation condition (i.e., uncorrelated predictors or correlated predictors with a variance-covariate matrix derived from a real data set) and class of weights (i.e., high or low), lighter (yellow/green) tiles indicate better performance, whereas darker (blue/purple) tiles indicate worse performance. Note: FPR, false positive rate; MAPE, mean absolute percent error (when is nonzero); MAE, mean absolute error (when is zero); PT, permutation test; QGC, quantile g-computation; RH, repeated holdout; WQSBS, bootstrap weighted quantile sum regression; WQSRS, random subset weighted quantile sum regression.

