. 2022 Aug 30;130(8):087010. doi: 10.1289/EHP10570

Figure 2.

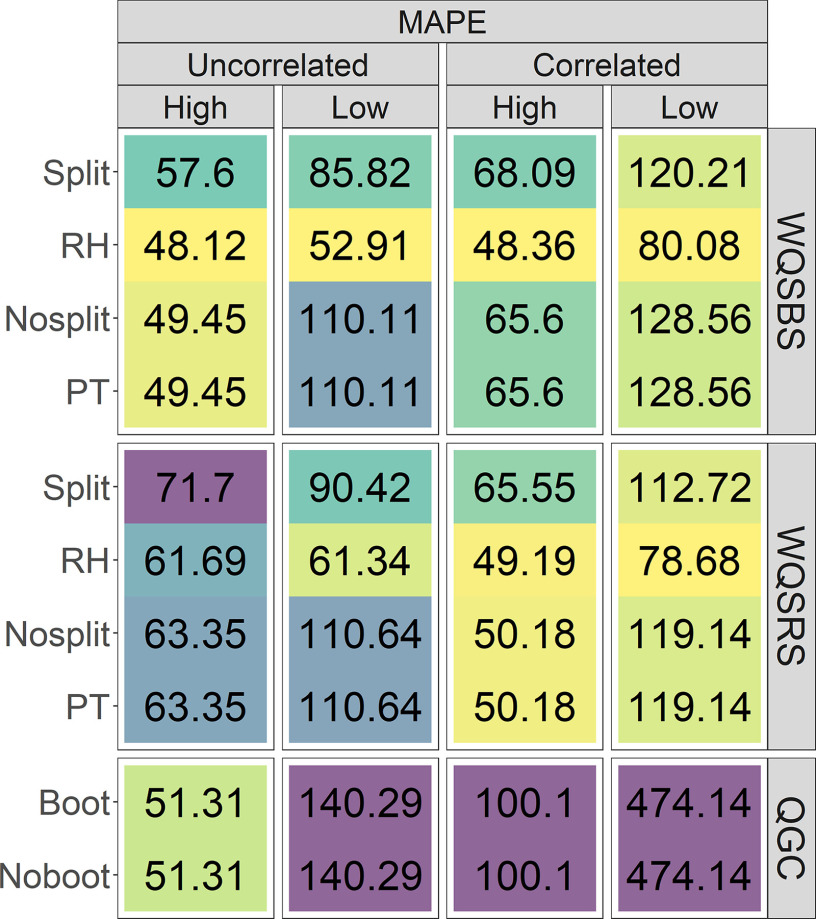
Figure 2 is a matrix that depicts Mean Absolute Percent Error for high and low mixture weight estimates rescaled as component-specific simulations. A tabular representation has three main rows, namely, bootstrap weighted quantile sum regression, Random subset weighted quantile sum regression and Quantile g–computation, and one main column, namely, Mean Absolute Percent Error. The Bootstrap weighted quantile sum regression and Random subset weighted quantile sum regression rows each are sub divided into four rows, namely, Split, Repeated holdout, Non-split, and Permutation test. The Quantile g–computation row is sub divided into two rows, namely, Boot and No-boot. The Mean Absolute Percent Error column is sub divided into two columns, namely, Uncorrelated and Correlated. The Uncorrelated and Correlated columns each are sub divided into two columns, namely, High and Low. Row 1: 57.6, 85.82, 68.09, and 120.21. Row 2: 48.12, 52.91, 48.36, and 80.08. Row 3: 49.45, 110.11, 65.6, and 128.56. Row 4: 49.45, 110.11, 65.6, and 128.56. Row 5: 71.7, 90.42, 65.55, and 112.72. Row 6: 61.69, 61.34, 49.19, and 78.68. Row 7: 63.35, 110.64, 50.18, and 119.14. Row 8: 63.35, 110.64, 50.18, and 119.14. Row 9: 51.31, 140.29, 100.1, and 474.14. Row 10: 51.31, 140.29, 100.1, and 474.14.

MAPE for high and low mixture weight estimates rescaled as component-specific coefficients in 500 simulations for nonzero mixture coefficients between correlation conditions. Within each simulation exposure correlation condition (i.e., uncorrelated predictors or correlated predictors with a variance-covariate matrix derived from a real data set) and class of weights (i.e., high or low), lighter (yellow/green) tiles indicate better performance, whereas darker (blue/purple) tiles indicate worse performance. Note: FPR, false positive rate; MAPE, mean absolute percent error (when β1 is nonzero); MAE, mean absolute error (when β1 is zero); PT, permutation test; QGC, quantile g-computation; RH, repeated holdout; WQSBS, bootstrap weighted quantile sum regression; WQSRS, random subset weighted quantile sum regression.