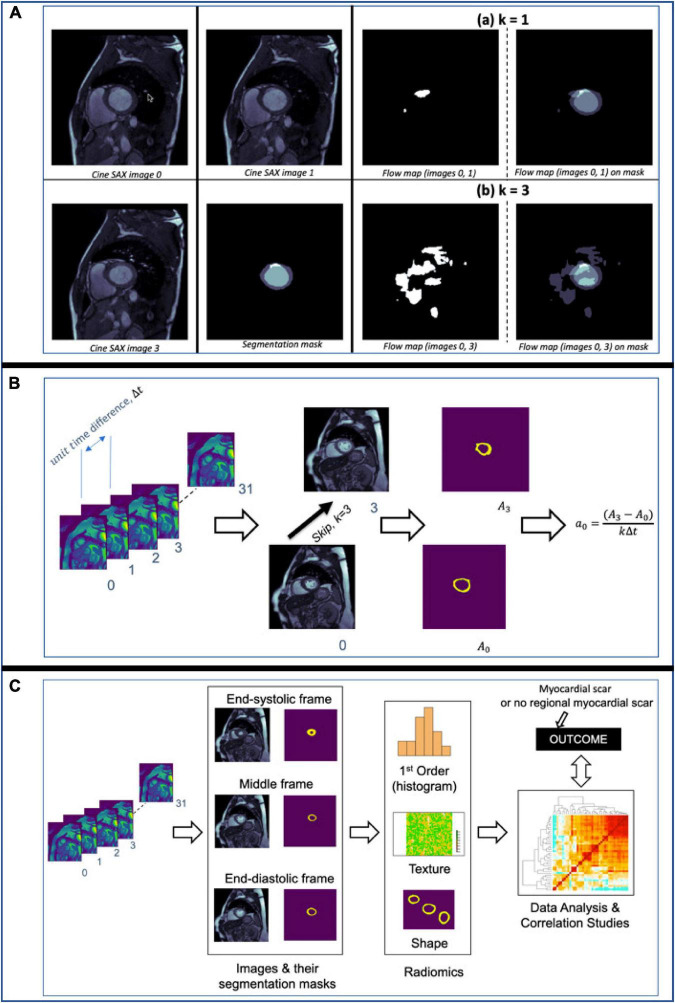
FIGURE 5.
(A) Flow maps showing the pixels that have been displaced between the time the two cine SAX image frames were acquired with the skip intervals k=1 in (a) and k=3 in (b). On the left in (a), flow map (images 0, 1) represents the pixel-wise displacement between image 0 and image 1, and the corresponding the pixel-wise displacement between image 0 and image 3 is shown at the bottom. The images on the left show the super-imposition of the flow map images on the segmentation masks. (B) An illustration of the computation of rate of change of myocardial cross-section area for a given slice location. The rate of change of myocardial area between frames captures the pixel-wise area change information of slices through the cardiac cycle. (C) An illustration of the computation of radiomics features of three frames namely, the end-diastolic (ED) frame, end-systolic (ES) frame and the “middle” frame in between the ED and ES frames. The shape, first-order, and texture radiomics features are extracted and then a statistical test (Pearson correlation analysis) to assess the significance of these features in relation to the binary outcome (i.e., with or without MI).

