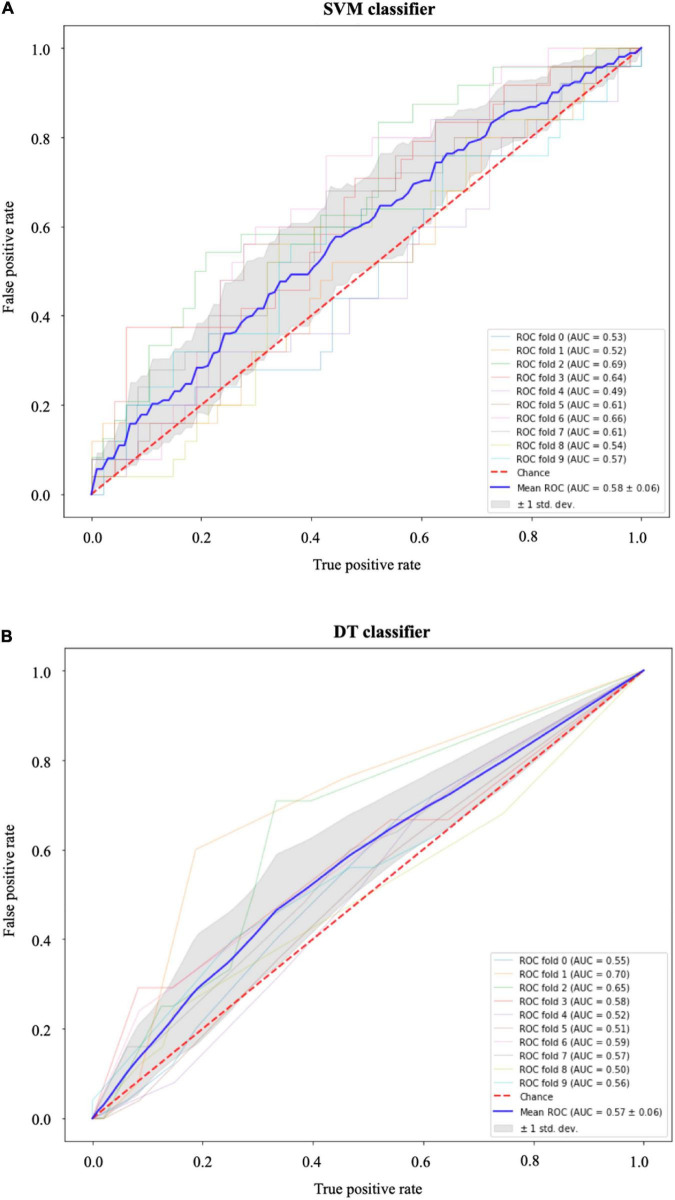
FIGURE 9.
Receiver operating characteristic (ROC) curves for (A) the support vector machines (SVM) and (B) the decision tree (DT) classifiers. In both models, the area under the curve (AUC) values (0.5 < AUC < 1) show that the classifiers have some predictive power above “chance” to distinguish between the positive class values from the negative class values. The gray area indicates ±1 SD calculated from 10-fold cross-validation.

