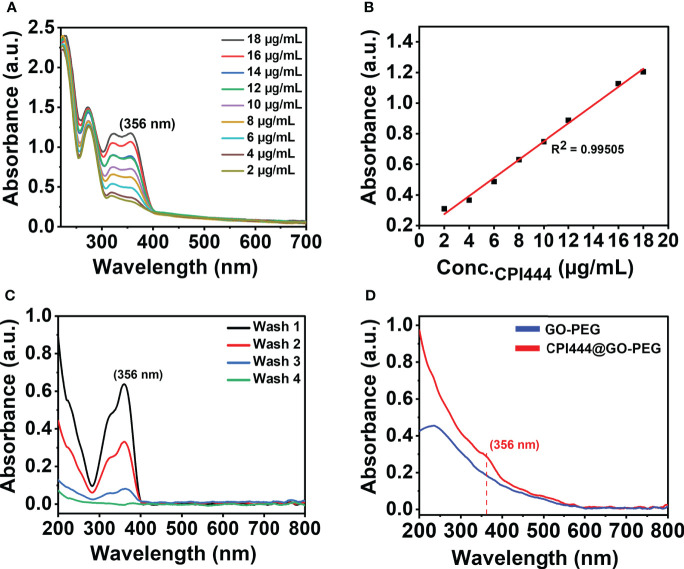
Figure 5.
Quantitative and qualitative analysis for the formation of CPI@GO-PEG using UV–vis spectroscopy: (A) UV–vis spectra of CPI444 solution recorded at different concentrations in (water: THF) solvent mixture, (B) Linear equation obtained from the standard curve at a wavelength maximum of 356 nm, (C) UV–vis spectra recorded for unbound CPI444, (D) UV–vis spectra for GO-PEG and purified CPI444@GO-PEG.

