Graph 1.

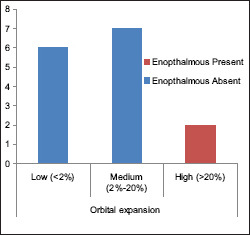
Graph depicting the number of patients and the percentage of rbital expansion (increase in volume) compared to the contralateral eye

Graph depicting the number of patients and the percentage of rbital expansion (increase in volume) compared to the contralateral eye