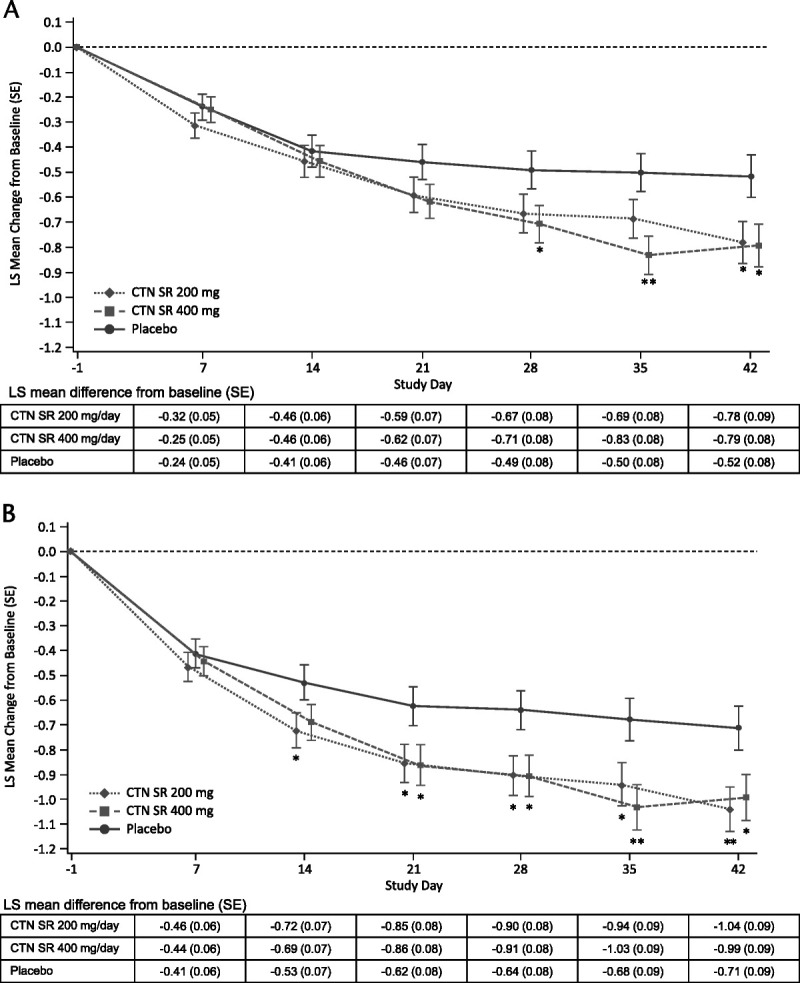
FIGURE 4.

Least-squares mean change from baseline to day 42 in CGI-S score (secondary endpoint) for (A) study 1 (NCT03605680) and (B) study 2 (NCT03605836). *P < 0.05 versus placebo, **P < 0.01 versus placebo. Note: Error bars are LS mean ± 1 SE. Data are based on an MMRM analysis for CGI-S score. Treatment differences were calculated based on the difference in LS mean changes versus placebo for MMRM.
