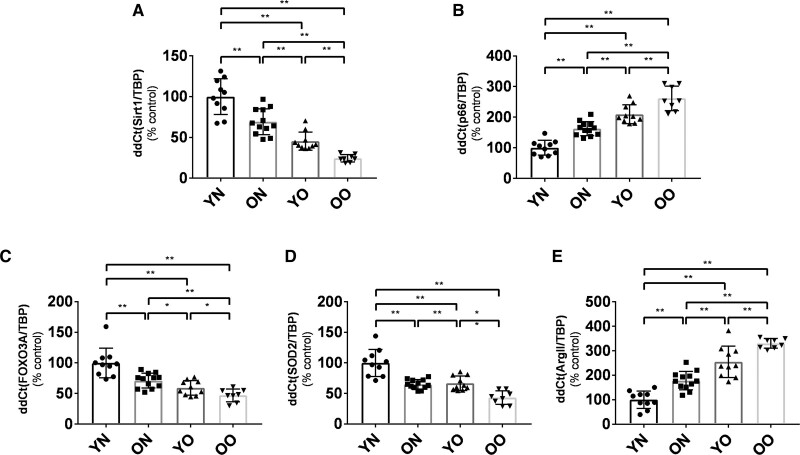
Figure 2.
Expression of SIRT1 (silent information regulator 1) and SIRT1-related genes in the vascular wall of the 4 groups. A, Expression of SIRT1. B, Expression of the pro-oxidant enzyme p66Shc. C, Expression of the antioxidant FOXO3 (Forkhead box protein O3). D, Expression of the SOD2 (superoxide dismutase-2). E, Expression of Arginase II. Results are expressed as % with respect to the Young Nonobese group. Shapiro-Wilk test was adopted to assess normality. FOXO3 and SOD2 were natural log-transformed for the means of the analyses. Young Nonobese: n=10, Old Nonobese: n=12, Young Obese: n=10, Old Obese: n=8. Data are presented as mean±SD and were compared by 2-way ANOVA followed by Holm-Sidak post hoc correction. A P<0.05 was considered significant. *P<0.05.**P<0.01. ArgII indicates Arginase II; FOXO3, Forkhead box protein O3; ON, old nonobese; OO, old obese; SOD-2, superoxide dismutase-2; YN, young nonobese; and YO, young obese.

