Figure 3.
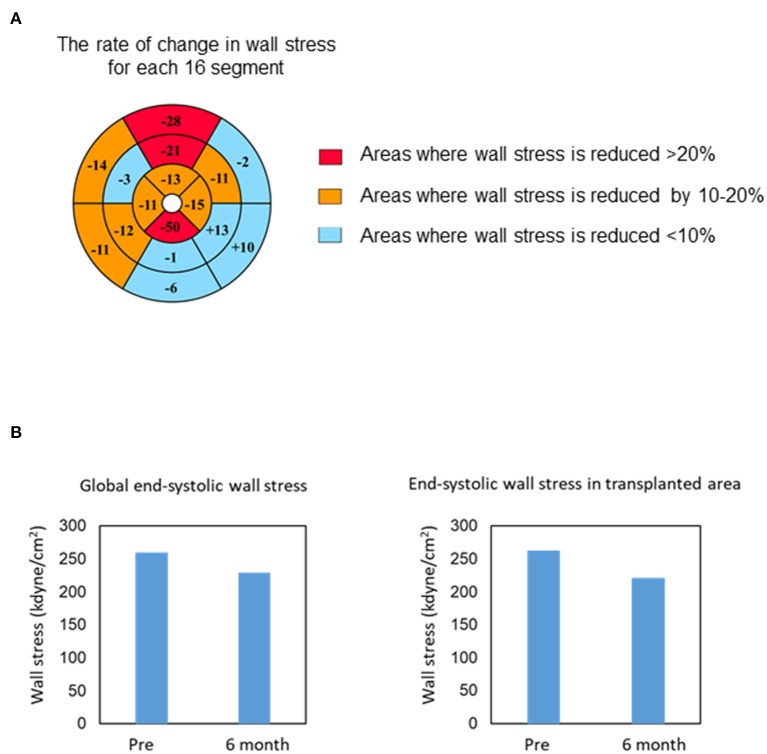
Changes in end-systolic wall stress. (A) Bull's-eye grid showing the changes in end-systolic wall stress before and 6 months after surgery, calculated by computed tomography. Red and orange highlight the areas of reduction in wall stress by over 20 and 10–20%, respectively. Light blue highlights the remaining areas. (B) Change in the global (left) and regional (transplanted area, right) end-systolic wall stress 6 months after transplantation.

