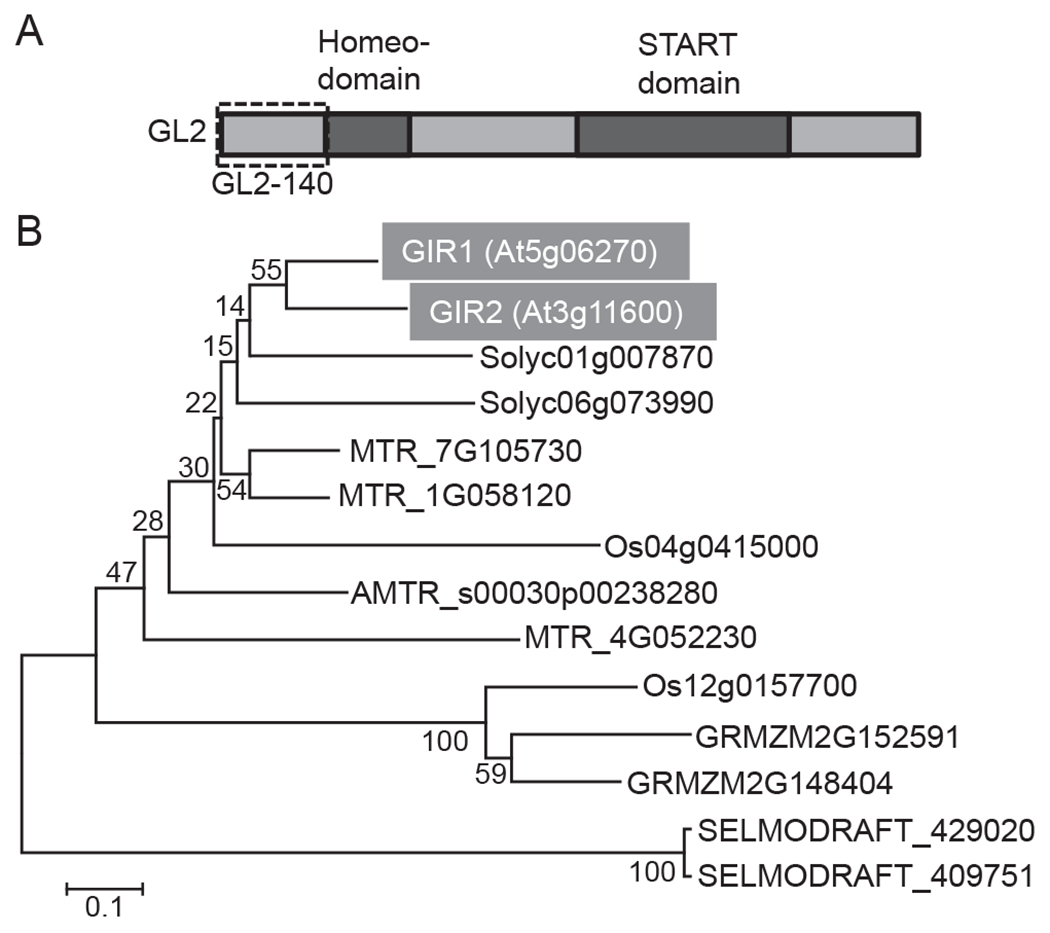
Fig. 1.

GL2 structure and phylogenetic analysis of GIR1 and GIR2. (A) Schematic representation of the GL2 domain structure. The GL2 N-terminal region, GL2-140, used for identification of GIR1 is delineated with a dashed box. (B) Phylogenetic tree of GIR1 and GIR2 homologs in different vascular plant species: Arabidopsis thaliana (GIR1, At), Zea mays (GRMZM), Oryza sativa (Os), Solanum lycopersicum (Solyc), Medicago truncatula (MTR), Amborella trichopoda (AMTR), and Selaginella moellendorffii (SELMODRAFT1). GIR1 and GIR2 are highlighted by shaded boxes and white letters. The evolutionary history was inferred using the Neighbor-Joining method [27]. The optimal tree with the sum of branch length of 3.86591361 is shown. The percentage of replicate trees in which the associated taxa clustered together in the bootstrap test (1000 replicates) are shown next to the branches [28]. The tree is drawn to scale, with branch lengths in the same units as those of the evolutionary distances used to infer the phylogenetic tree. The evolutionary distances were computed using the Poisson correction method [29] and are in the units of the number of amino acid substitutions per site. All positions containing gaps and missing data were eliminated. There were a total of 79 positions in the final dataset. Evolutionary analyses were conducted using the Molecular Evolutionary Genetics Analysis tool (MEGA, version 6.0.5 for Mac OS) (http://www.megasoftware.net), which also generated this description of the analysis. Bar, 0.1 amino acid substitutions per site.
