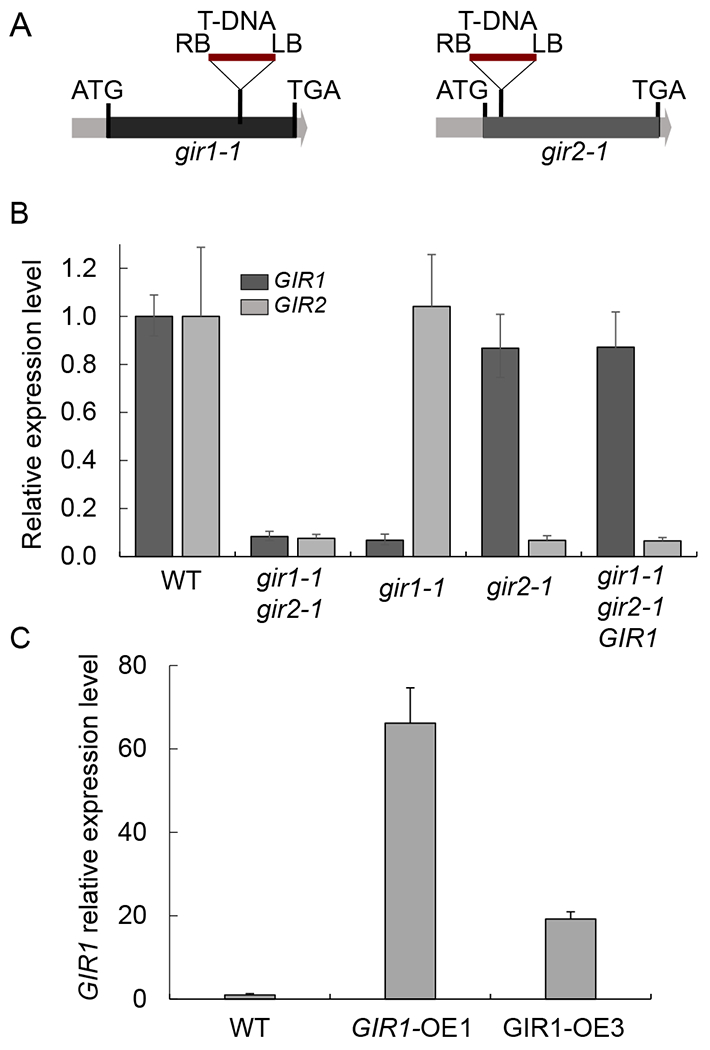
Fig. 3.

Quantitative RT-PCR analysis of GIR1 gene expression in mutant gir1-1 and over-expressing GIR1-OE plants. (A) Schematic representation of the locations of the mutagenic T-DNA integration sites in the gir1-1 and gir2-1 mutants. LB and RB, T-DNA left and right borders. Black boxes delineate the single exons of GIR1 and GIR2 between their translation initiation (ATG) and termination codons (TGA). (B) Relative expression levels of the GIR1 (dark gray boxes) and GIR2 genes (light gray boxes) in 6-week-old wild-type (WT) plants and the indicated loss-of-function and genetically complemented mutant lines. The expression level of each of the genes in the WT plants is set to 1.0, and error bars represent SEM of N = 3 independent biological replicates. (C) Relative expression levels of GIR1 in WT plants and the indicated gain-of-function lines. The expression level in the WT plants is set to 1.0, and error bars represent SEM of N = 3 independent biological replicates.
