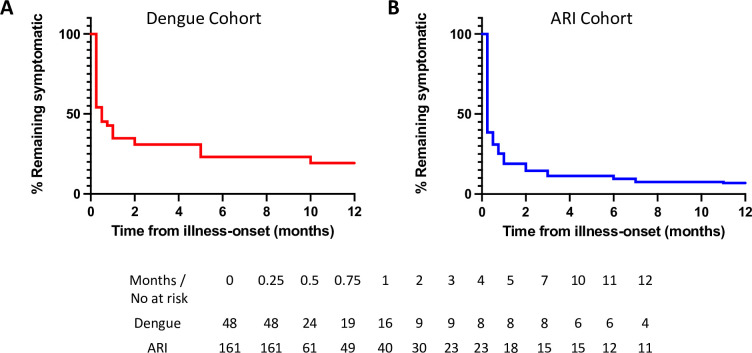
Fig 2. Kaplan-Meier curve of time to symptom resolution.
Each curve shows the overall time to symptom resolution (in months) after illness-onset in patients with (A) dengue and (B) acute viral respiratory infection (ARI). The numbers of patients at risk for each of these two groups are shown in the table immediately below the Kaplan-Meier curves.

