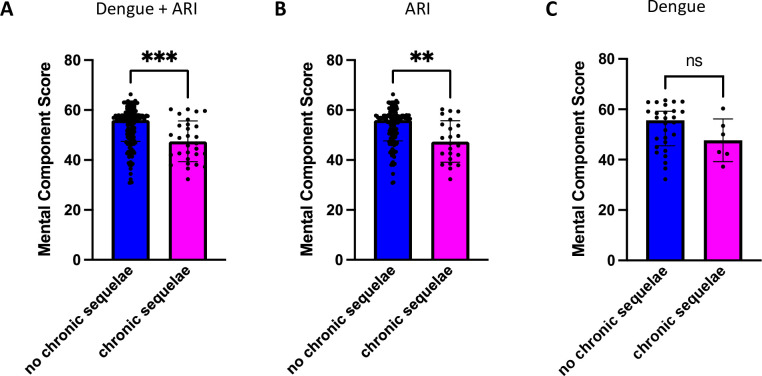
Fig 3. SF12v2 Mental Component Summary (MCS) Score at month 3 in patients with and without chronic sequelae.
(A) Comparison of MCS scores in both the dengue and ARI cohorts combined. (B) Comparison of MCS scores within the ARI cohort. (C) Comparison of MCS scores within the dengue cohort. Blue bars represent the group without chronic symptoms while magenta bars represent the group with chronic symptoms. Black dots indicate the individual MCS values. Summary plots show the median MCS with error bars representing the interquartile range. Statistics to compare the median MCS between groups was calculated using the Mann-Whitney test. *** = p < 0.001, **** = p <0.0001, ns = not significant.

