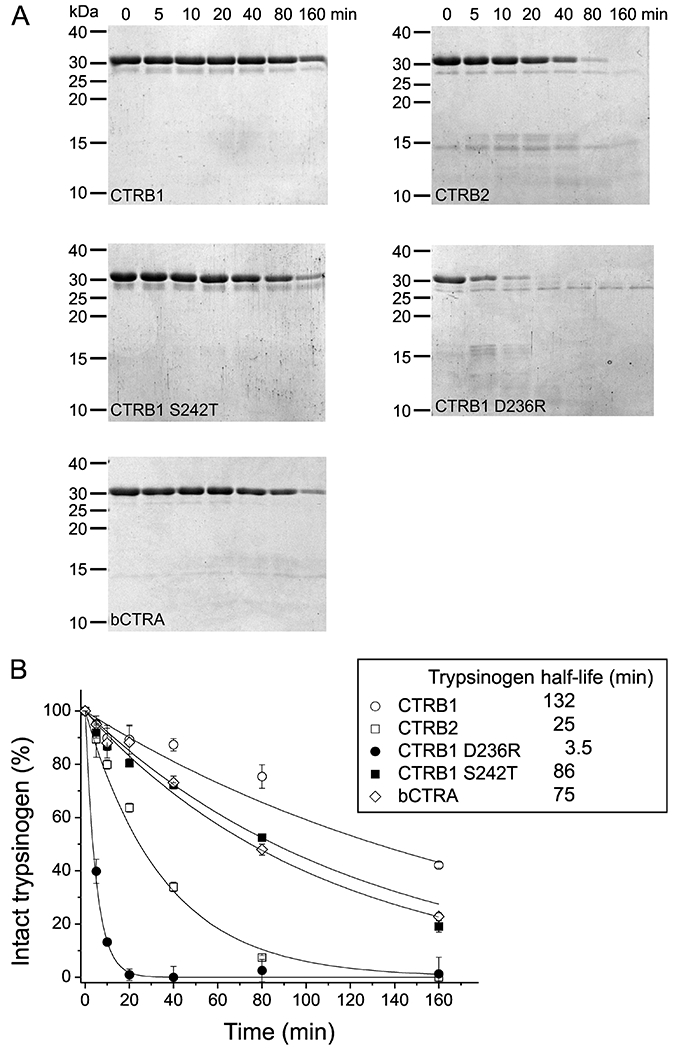
Figure 8. Degradation of human anionic trypsinogen by CTRB1, CTRB2, bCTRA and CTRB1 mutants D236R and S242T.

A, Degradation of anionic trypsinogen (1 μM) by chymotrypsin (50 nM) was assayed as described in Materials and Methods. At given times, reactions were stopped by adding 100% trichloroacetic acid to 13% final concentration. Precipitated proteins were recovered by centrifugation, resuspended, and analyzed by SDS PAGE with Coomassie Brilliant Blue R-250 staining. B, Densitometric evaluation of the intact trypsinogen band. The mean values from two separate measurements for each incubation time are shown. At each time point, the density was divided by the initial density value and these relative values were plotted as a function of time. An exponential decay curve was fitted to each dataset. Half-lives for anionic trypsinogen indicated in the inset were calculated from the fitted curves.
