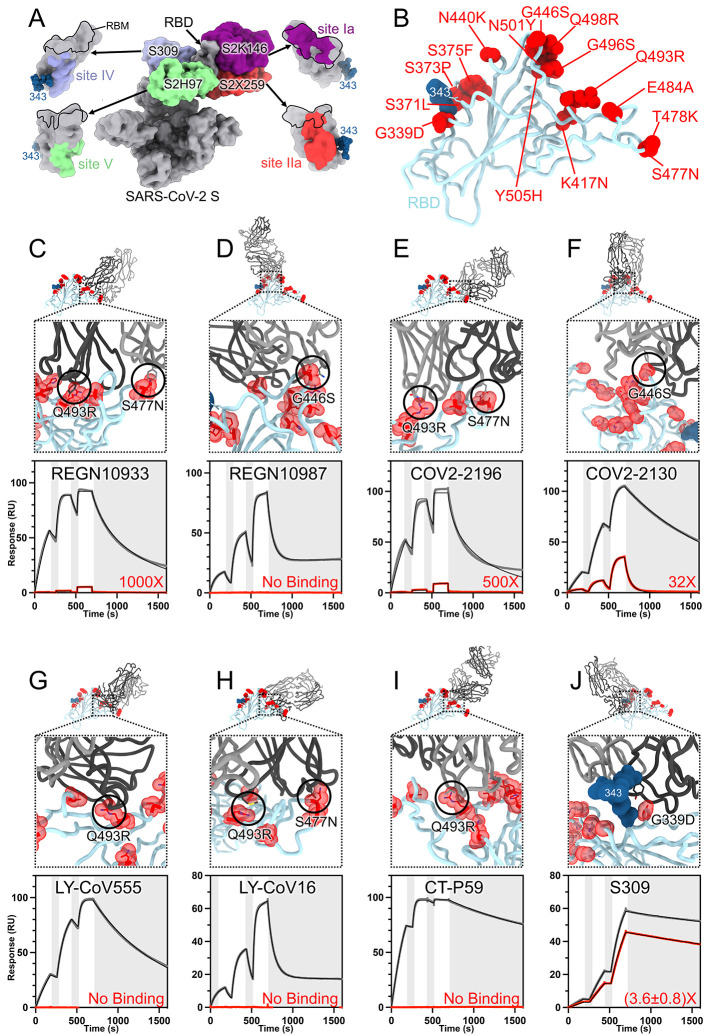
Fig. 3. SARS-CoV-2 Omicron RBD mutations promote escape from a panel of clinical mAbs.
(A, RBD antigenic map as determined elsewhere (13). (B) Ribbon diagram of the RBD crystal structure with residue mutated relative to the Wuhan-Hu-1 RBD shown as red spheres. The N343 glycan is rendered as blue spheres. (C to J) Zoomed-in view of the Omicron RBD (blue) superimposed on structures of clinical mAbs (grey) highlighting (black circles) selected residues that interfere with the mAbs: (C) REGN10933, (D) REGN10987, (E) COV2-2196, (F) COV2-2130, (G) LY-CoV555, (H) LY-CoV16, (I) CT-P59, and (J) S309 which does not clash with G339D. Panels A-I were rendered with the crystal structure whereas panel J was generated using the cryoEM model. Binding of the Wuhan-Hu-1 (gray line) or Omicron (red line) RBD to the corresponding mAb was evaluated using surface plasmon resonance (single-cycle kinetics) and is shown underneath each structural superimposition. White and gray stripes are association and dissociation phases, respectively. The black line is a fit to a kinetic model. The decrease in affinity between Wuhan-Hu-1 and Omicron binding is indicated in red. Results are consistent with IgG binding to S ectodomains (fig. S3).

