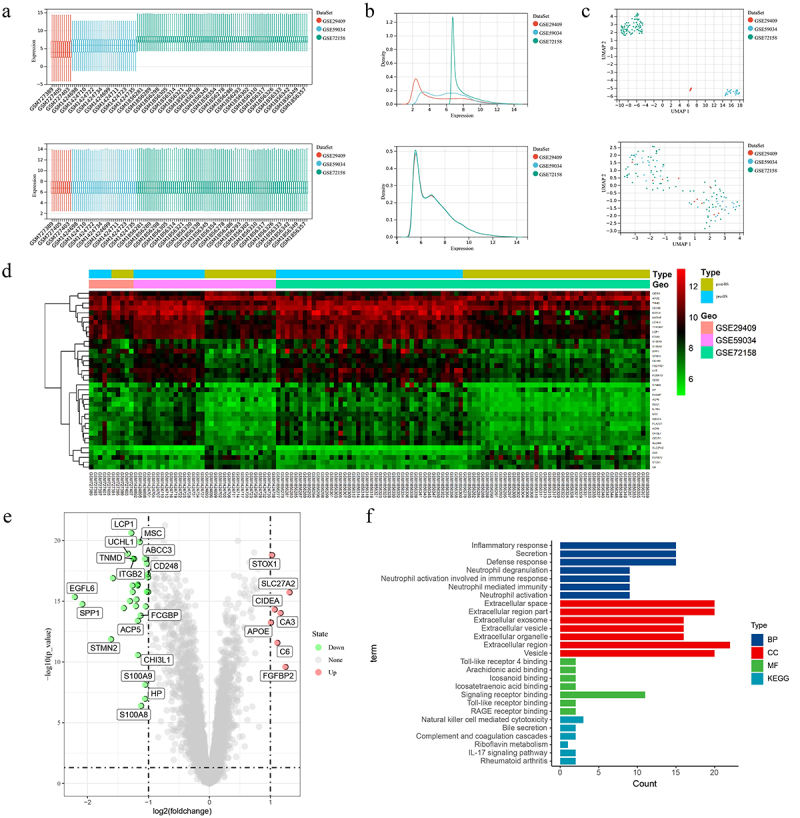
Figure 1.

Data merging, analysis and feature enrichment. (a, b, c) After removing the batch effect the data distribution tends to be consistent across datasets with similar means and variances, and the samples are clustered and intertwined with each other between datasets. (d) Heat map of 37 DEGs was obtained from the analysis of the merged data. (e) Green circles represent 30 down-regulated DEGs and red circles represent 7 up-regulated DEGs in the volcano plot. (f) GO and KEGG analysis of all DEGs. DEGs, differentially expressed genes; GO, Gene Ontology; KEGG, Kyoto Encyclopaedia of Genes and Genomes.
