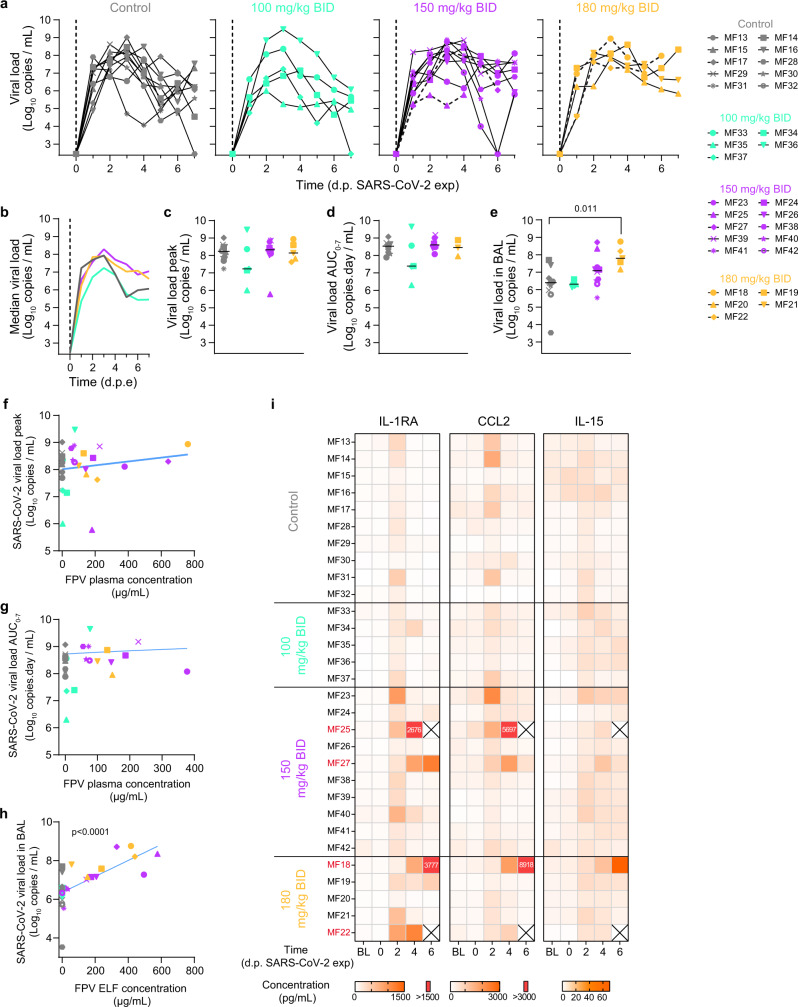
Fig. 4. Viral kinetic and pharmacokinetic in the respiratory tract of SARS-CoV-2-infected cynomolgus macaques treated with FPV.
a Individual nasopharyngeal viral loads determined by RT-PCR in all animals; b Median nasopharyngeal viral load values observed in each treatment group; c, d Viral kinetic parameters (peak and AUC viral load) during the first 7 days of infection. e Viral load in bronchoalveolar lavages (BAL) at 3 dpe. Median value is indicated by horizontal bar. Parameters were compared between groups using Kruskal-Wallis test following Dunn’s multiple comparisons. f, g Viral kinetic parameters (peak and AUC viral load between 0 and 7 dpi) according to geometric mean FPV plasma trough concentration. h Viral load in BAL according to FPV concentration in the epithelial lining fluid (ELF). A Spearman correlation test was performed to assess the association between drug concentration and viral kinetic parameters. Two-tailed p value is indicated. Grey: untreated; cyan: 100 mg/kg BID; purple: 150 mg/kg BID; yellow: 180 mg/kg BID. i Heatmaps of the concentrations of IL-1RA, CCL2 and IL-15 measured in plasma SARS-CoV-2 infected animals. The color scale (in pg.mL−1) is shown at the bottom. Source data are provided as a Source Data file.

