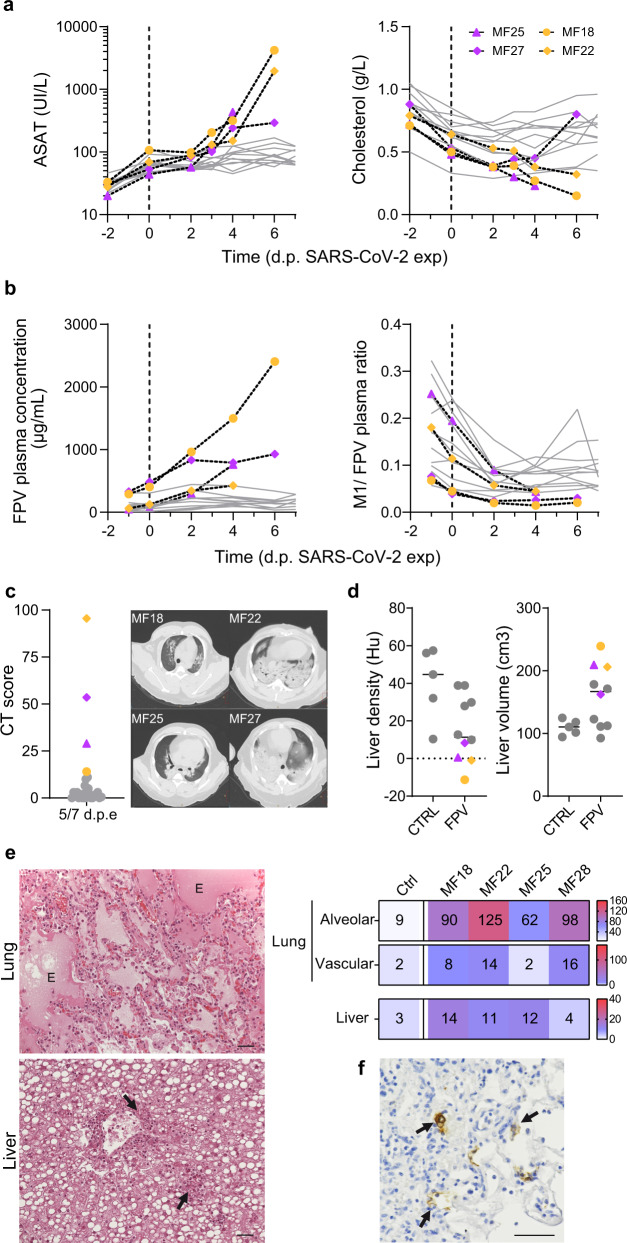
Fig. 5. Exacerbation of SARS-CoV-2 induced disease in four FPV-treated macaques.
Four infected animals treated with FPV were early euthanized after reach of humane endpoint. a Analyze of ASAT and Cholesterol levels in plasma of treated infected animals. b Longitudinal evolution of FPV concentration and M1/FPV ratio in plasma. c Lung lesions were assessed by chest CT at 5 dpe. Overall CT score are indicated, historical untreated animal were showed in grey. Representative images of lung lesions in the four NHPs. d Liver density and volume was assessed by CT scan at 5 dpe. Values for MF18, MF22, MF25, and MF27 are indicated in color according to the FPV dose (pink: 150 mg/kg BID and yellow: 180 mg/kg BID), and other FPV treated animals were indicated in grey. Median value is indicated by horizontal bar. Source data are provided as a Source Data file. e Tissue lesions and cell infiltrates were analyzed at necropsy and histological score for lung (alveolar and vascular areas) and liver were shown for the 4 NHPs in comparison with control animals (median of n = 5). Representative images of lung (top) and liver (down) were shown. The letter E indicates presence of edema and black arrows show the neutrophilic infiltration. f Presence of SARS-CoV-2 infected cells in lung tissue was exhibited anti-Nucleocapsid antibody. Black arrows indicated infected cells. The black bars indicate 50 μm.

