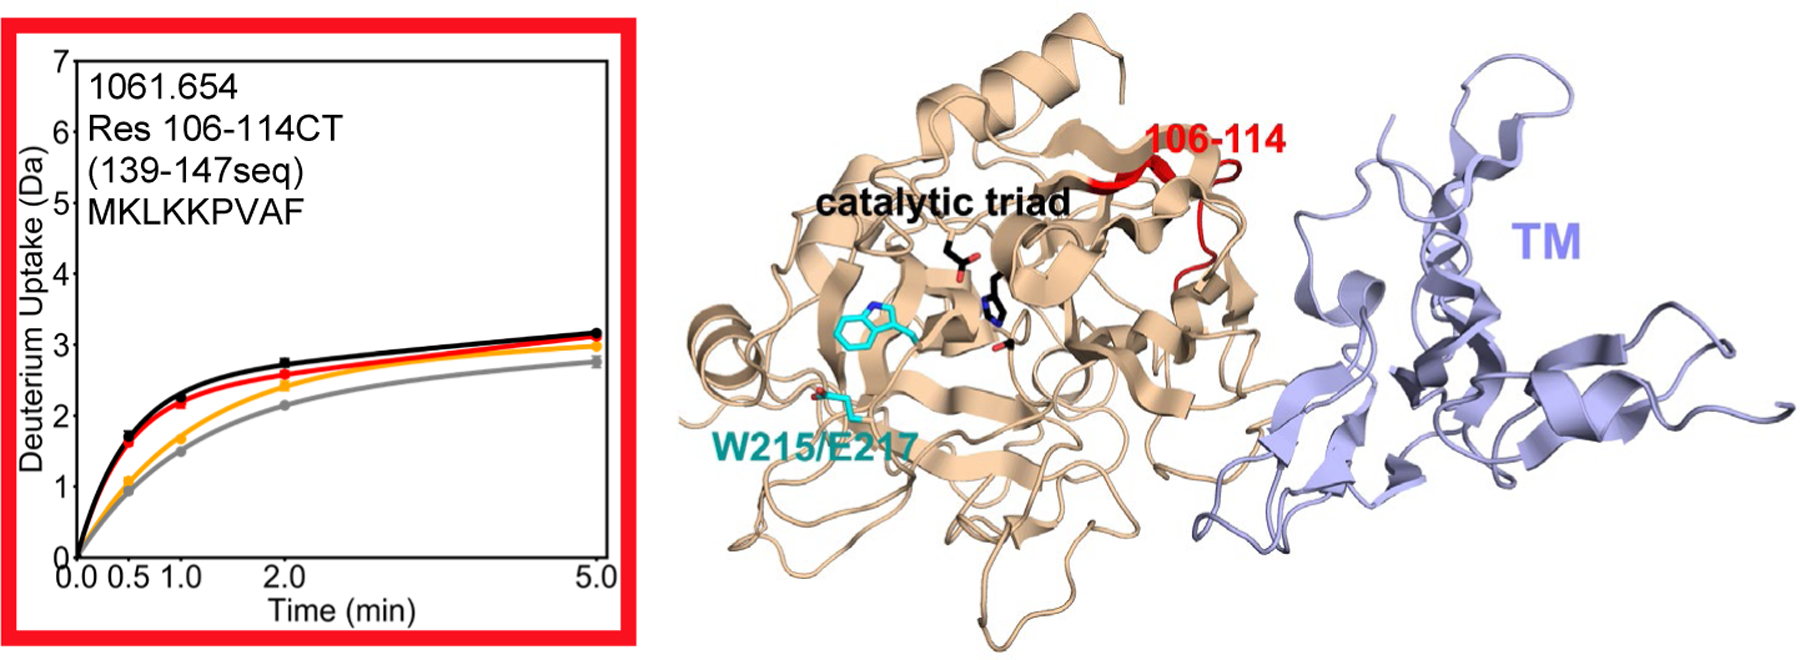
Figure 2.

Crystal structure of thrombin (wheat) bound to TM456 (light blue) [PDB ID: 1DX5], and the HDXMS deuterium uptake plot for residues 106–114CT (139–147seq) colored red on the structure. Sidechains are shown for the catalytic triad (black), and for Trp 215 and Glu 217 (cyan). The black and grey curves correspond to WT thrombin and WT thrombin-TM456, and the red and orange curved correspond to W215A/E217A thrombin and W215A/E217A-TM456 respectively. HDXMS error bars are shown but often lie within the symbols.
